Introduction
We have developed a single-cell analysis pipeline that is fully implemented in R statistical processing language named “SingCellaR”. It facilitates scRNA-seq from multiple single cell datasets obtained from different tissues or donors.
SingCellaR was designed to integrate and analyse scRNA-seq data. It provides standard functionalities for analyzing scRNA-seq from plate-based and droplet-based platforms. Multiple methods for sample integration, dimensionality reduction, data visualization and trajectory analysis are incorporated (Fig. 1).
SingCellaR analysis workflow
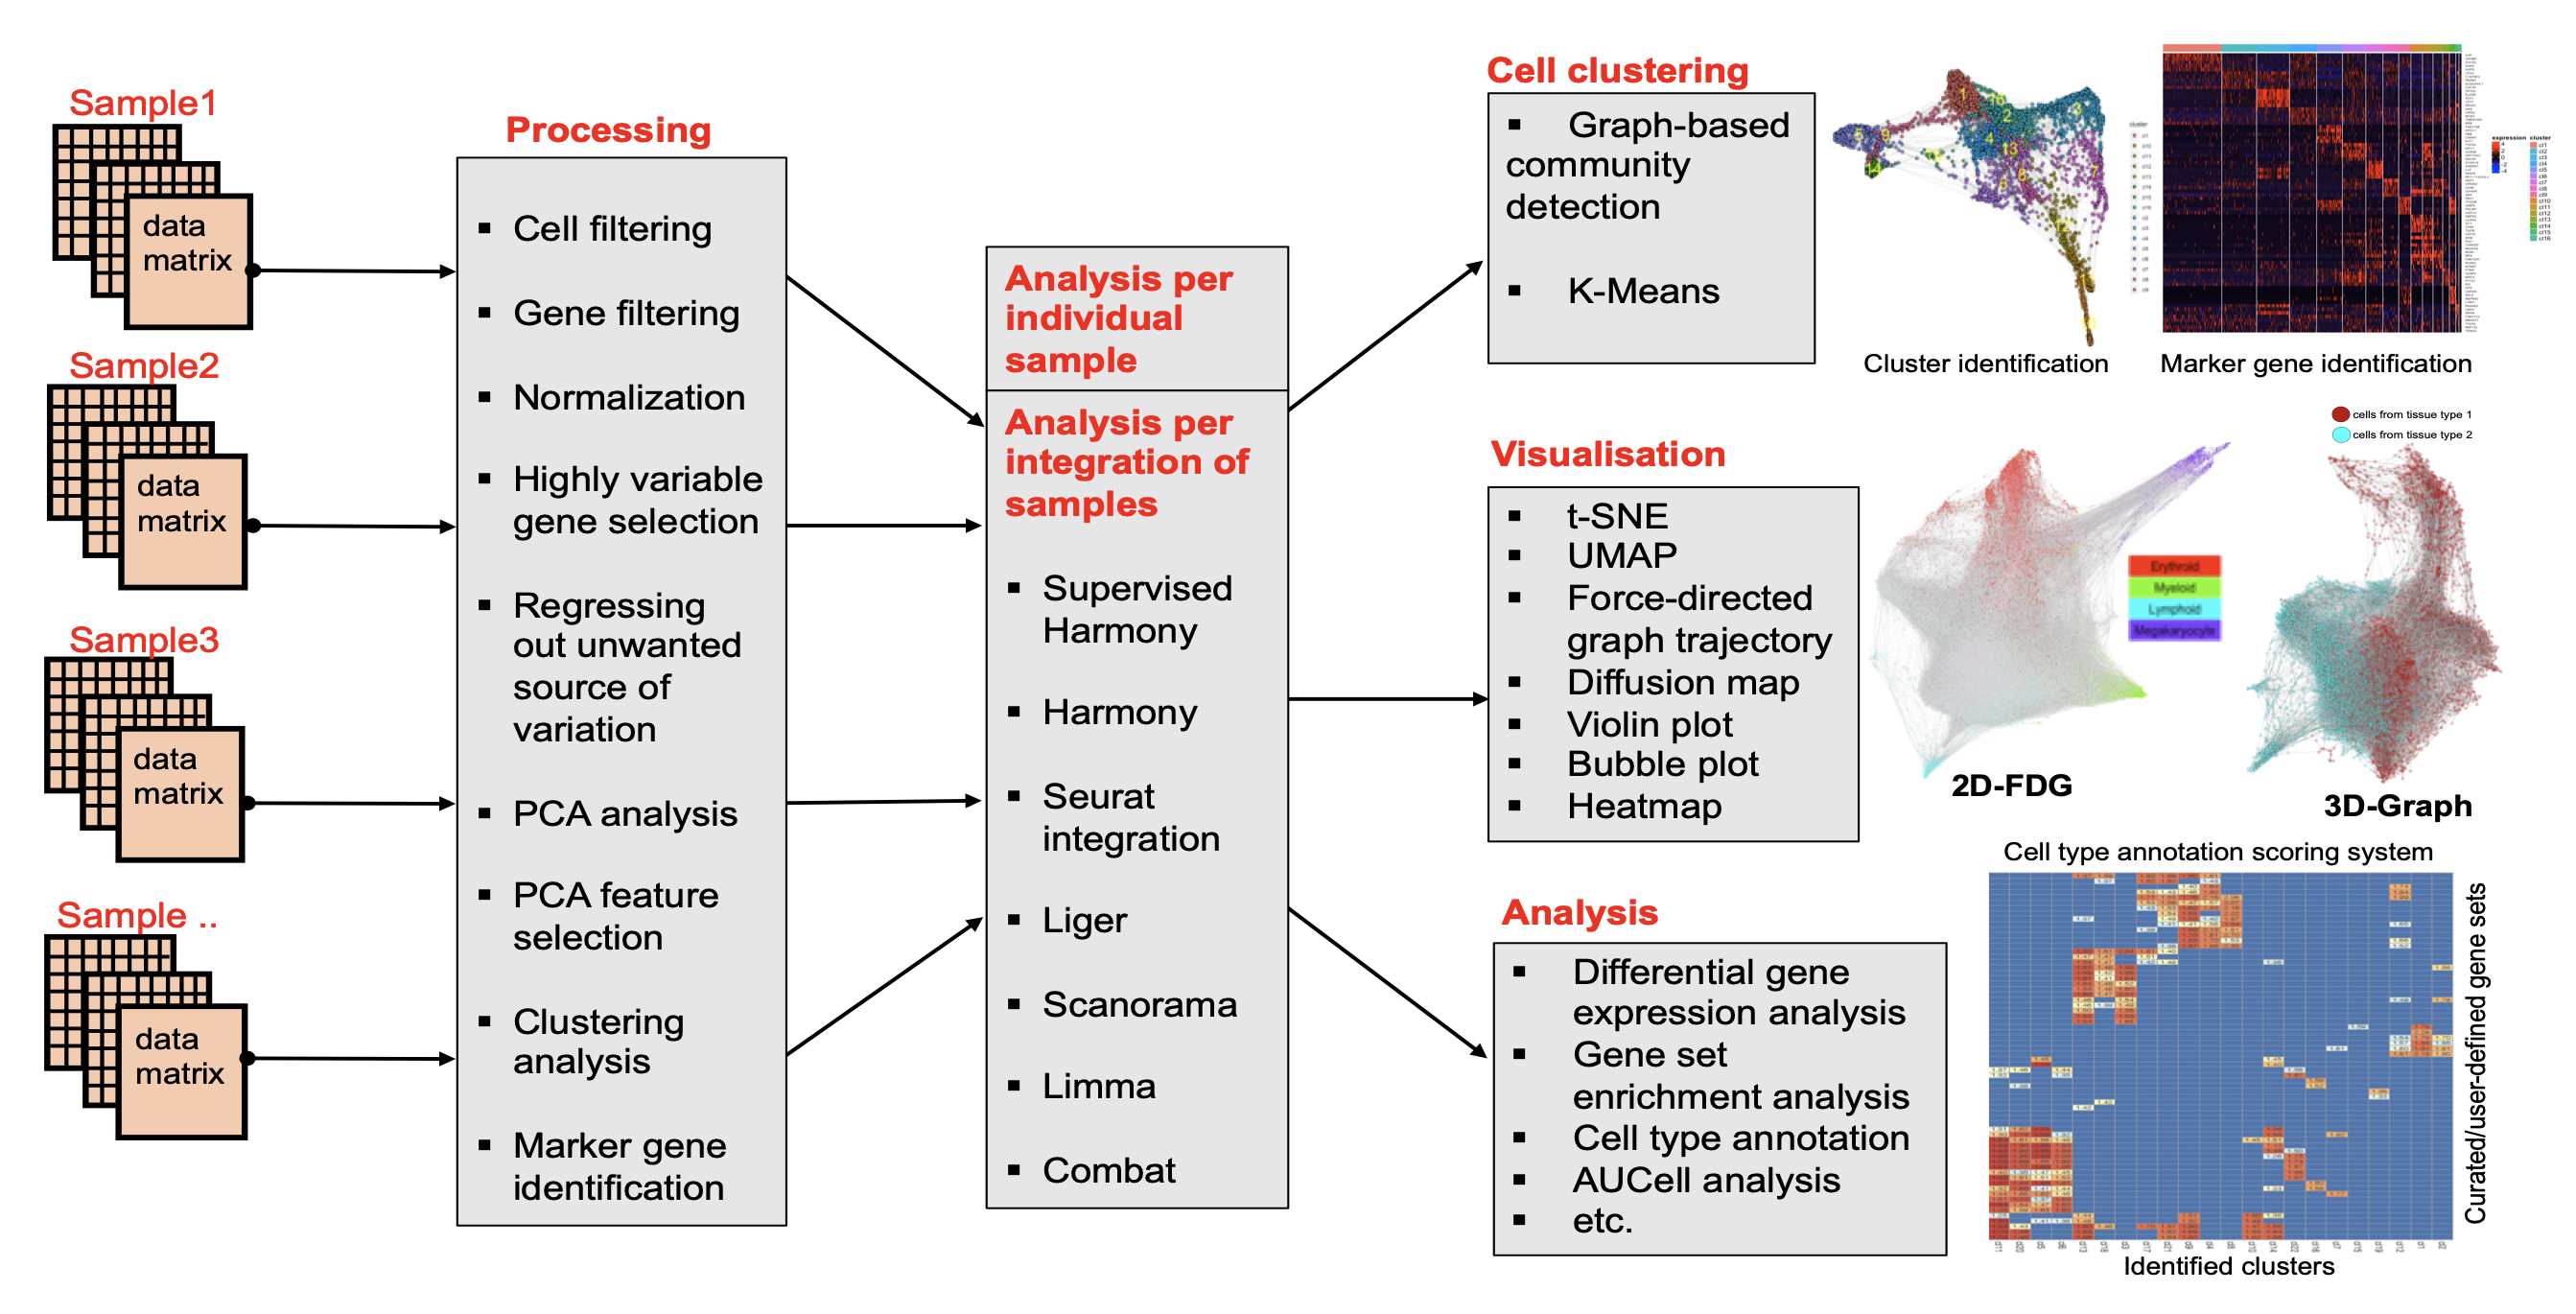
Figure 1
SingCellaR reads in expression matrices in multiple formats (e.g., Cell Ranger MEX output and other relevant tabular formats). Data processing, cell and gene filtering, normalization, highly variable gene selection, removal unwanted source of variation, dimension reduction, clustering and differential gene analyses will be performed by user defined parameters. SingCellaR facilitates individual sample analysis and the integrative analysis of multiple samples. We have developed ‘supervised harmony’ method for the integrative method of multiple samples. Existing integrative approaches (e.g., Harmony, Seurat’s CCA and RPCA, Liger, Scanorama, and Combat) are included in the package. SingCellaR uses Louvain community-detection clustering method based on the weighted graph network to identify clusters. K-means clustering is also available based on the user-defined parameters. Various dimensionality reduction techniques including 2D and 3D plot-functions are included. Force-directed graph (FDG), KNN-Graph, and Diffusion map are used to visualize cellular trajectory. SingCellaR provides further more analyses. These include differential gene expression, marker gene identification, gene set enrichment, AUCell analyses, and the cell-type annotation system. The full list of implemented functions is described in SingCellaR’s documentation.