SingCellaR analysis workflow
Loading the previous integrative object
First, SingCellaR integrative object from the previous analysis will be loaded.
library(SingCellaR)

human_HSPCs<-local(get(load(file="../SingCellaR_example_datasets/Psaila_et_al/SingCellaR_objects/human_HSPCs_v0.1.SingCellaR.rdata")))
human_HSPCs
## An object of class SingCellaR with a matrix of : 33538 genes across 5000 samples.The ‘harmony’ integration will be used to demonstrate downstream analyses.
Clustering analysis
The critical parameters are ‘useIntegrativeEmbeddings’ and ‘integrative_method’. The user has to set ‘useIntegrativeEmbeddings=T’ and add the integrative method name in the parameter ‘integrative_method’, which is ‘harmony’ in this case.
identifyClusters(human_HSPCs,useIntegrativeEmbeddings = T,integrative_method = "harmony", n.dims.use = 20,n.neighbors = 50, knn.metric = "euclidean")## [1] "Building Annoy index with metric = euclidean , n_trees = 50"
## [1] "Searching Annoy index, search_k = 5000"
## [1] "Building graph network.."
## [1] "Building graph network is done."
## [1] "Process community detection.."
## [1] "Louvain analysis is done!."Plot UMAP with identified clusters
plot_umap_label_by_clusters(human_HSPCs,show_method = "louvain")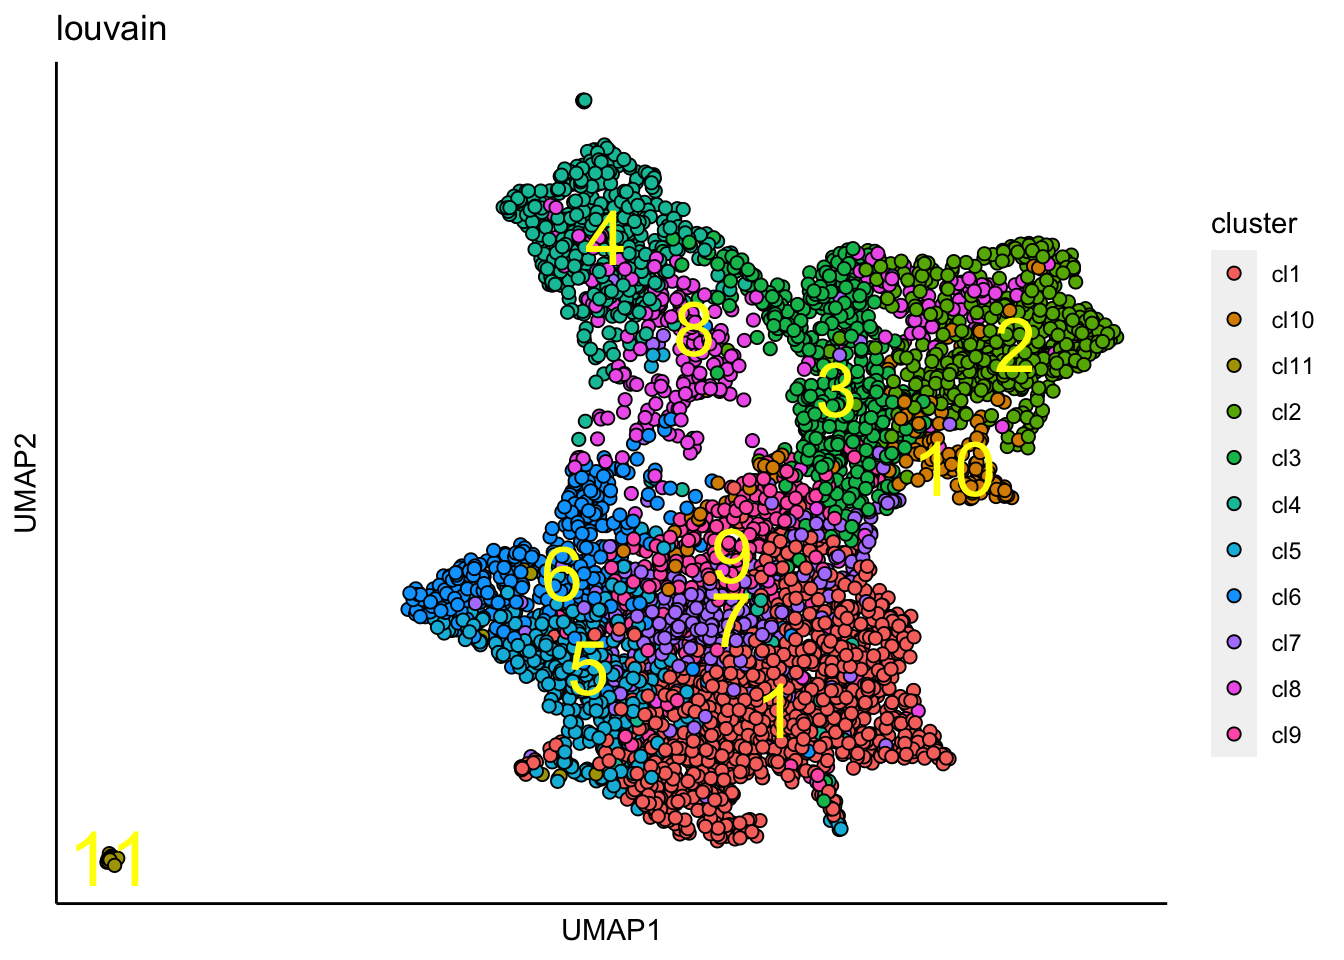
The UMAP plot shows that the cluster10 is clearly distinct from other clusters. This might be an indication of a contaminated cell type. To investigate further, marker genes identification is then performed.
Marker gene identification
findMarkerGenes(human_HSPCs,cluster.type = "louvain")## [1] "Number of genes for analysis: 16184"
## [1] "Creating binary matrix.."
## [1] "Finding differential genes.."
## [1] "Identifying marker genes for: cl1"
## [1] "Processing Fisher's exact test!"
## [1] "Processing Wilcoxon Rank-sum test!"
## [1] "Combining p-values using the fisher's method!"
## [1] "Identifying marker genes for: cl2"
## [1] "Processing Fisher's exact test!"
## [1] "Processing Wilcoxon Rank-sum test!"
## [1] "Combining p-values using the fisher's method!"
## [1] "Identifying marker genes for: cl3"
## [1] "Processing Fisher's exact test!"
## [1] "Processing Wilcoxon Rank-sum test!"
## [1] "Combining p-values using the fisher's method!"
## [1] "Identifying marker genes for: cl4"
## [1] "Processing Fisher's exact test!"
## [1] "Processing Wilcoxon Rank-sum test!"
## [1] "Combining p-values using the fisher's method!"
## [1] "Identifying marker genes for: cl5"
## [1] "Processing Fisher's exact test!"
## [1] "Processing Wilcoxon Rank-sum test!"
## [1] "Combining p-values using the fisher's method!"
## [1] "Identifying marker genes for: cl6"
## [1] "Processing Fisher's exact test!"
## [1] "Processing Wilcoxon Rank-sum test!"
## [1] "Combining p-values using the fisher's method!"
## [1] "Identifying marker genes for: cl7"
## [1] "Processing Fisher's exact test!"
## [1] "Processing Wilcoxon Rank-sum test!"
## [1] "Combining p-values using the fisher's method!"
## [1] "Identifying marker genes for: cl8"
## [1] "Processing Fisher's exact test!"
## [1] "Processing Wilcoxon Rank-sum test!"
## [1] "Combining p-values using the fisher's method!"
## [1] "Identifying marker genes for: cl9"
## [1] "Processing Fisher's exact test!"
## [1] "Processing Wilcoxon Rank-sum test!"
## [1] "Combining p-values using the fisher's method!"
## [1] "Identifying marker genes for: cl10"
## [1] "Processing Fisher's exact test!"
## [1] "Processing Wilcoxon Rank-sum test!"
## [1] "Combining p-values using the fisher's method!"
## [1] "Identifying marker genes for: cl11"
## [1] "Processing Fisher's exact test!"
## [1] "Processing Wilcoxon Rank-sum test!"
## [1] "Combining p-values using the fisher's method!"plot_heatmap_for_marker_genes(human_HSPCs,cluster.type = "louvain",n.TopGenes = 5,rowFont.size = 5)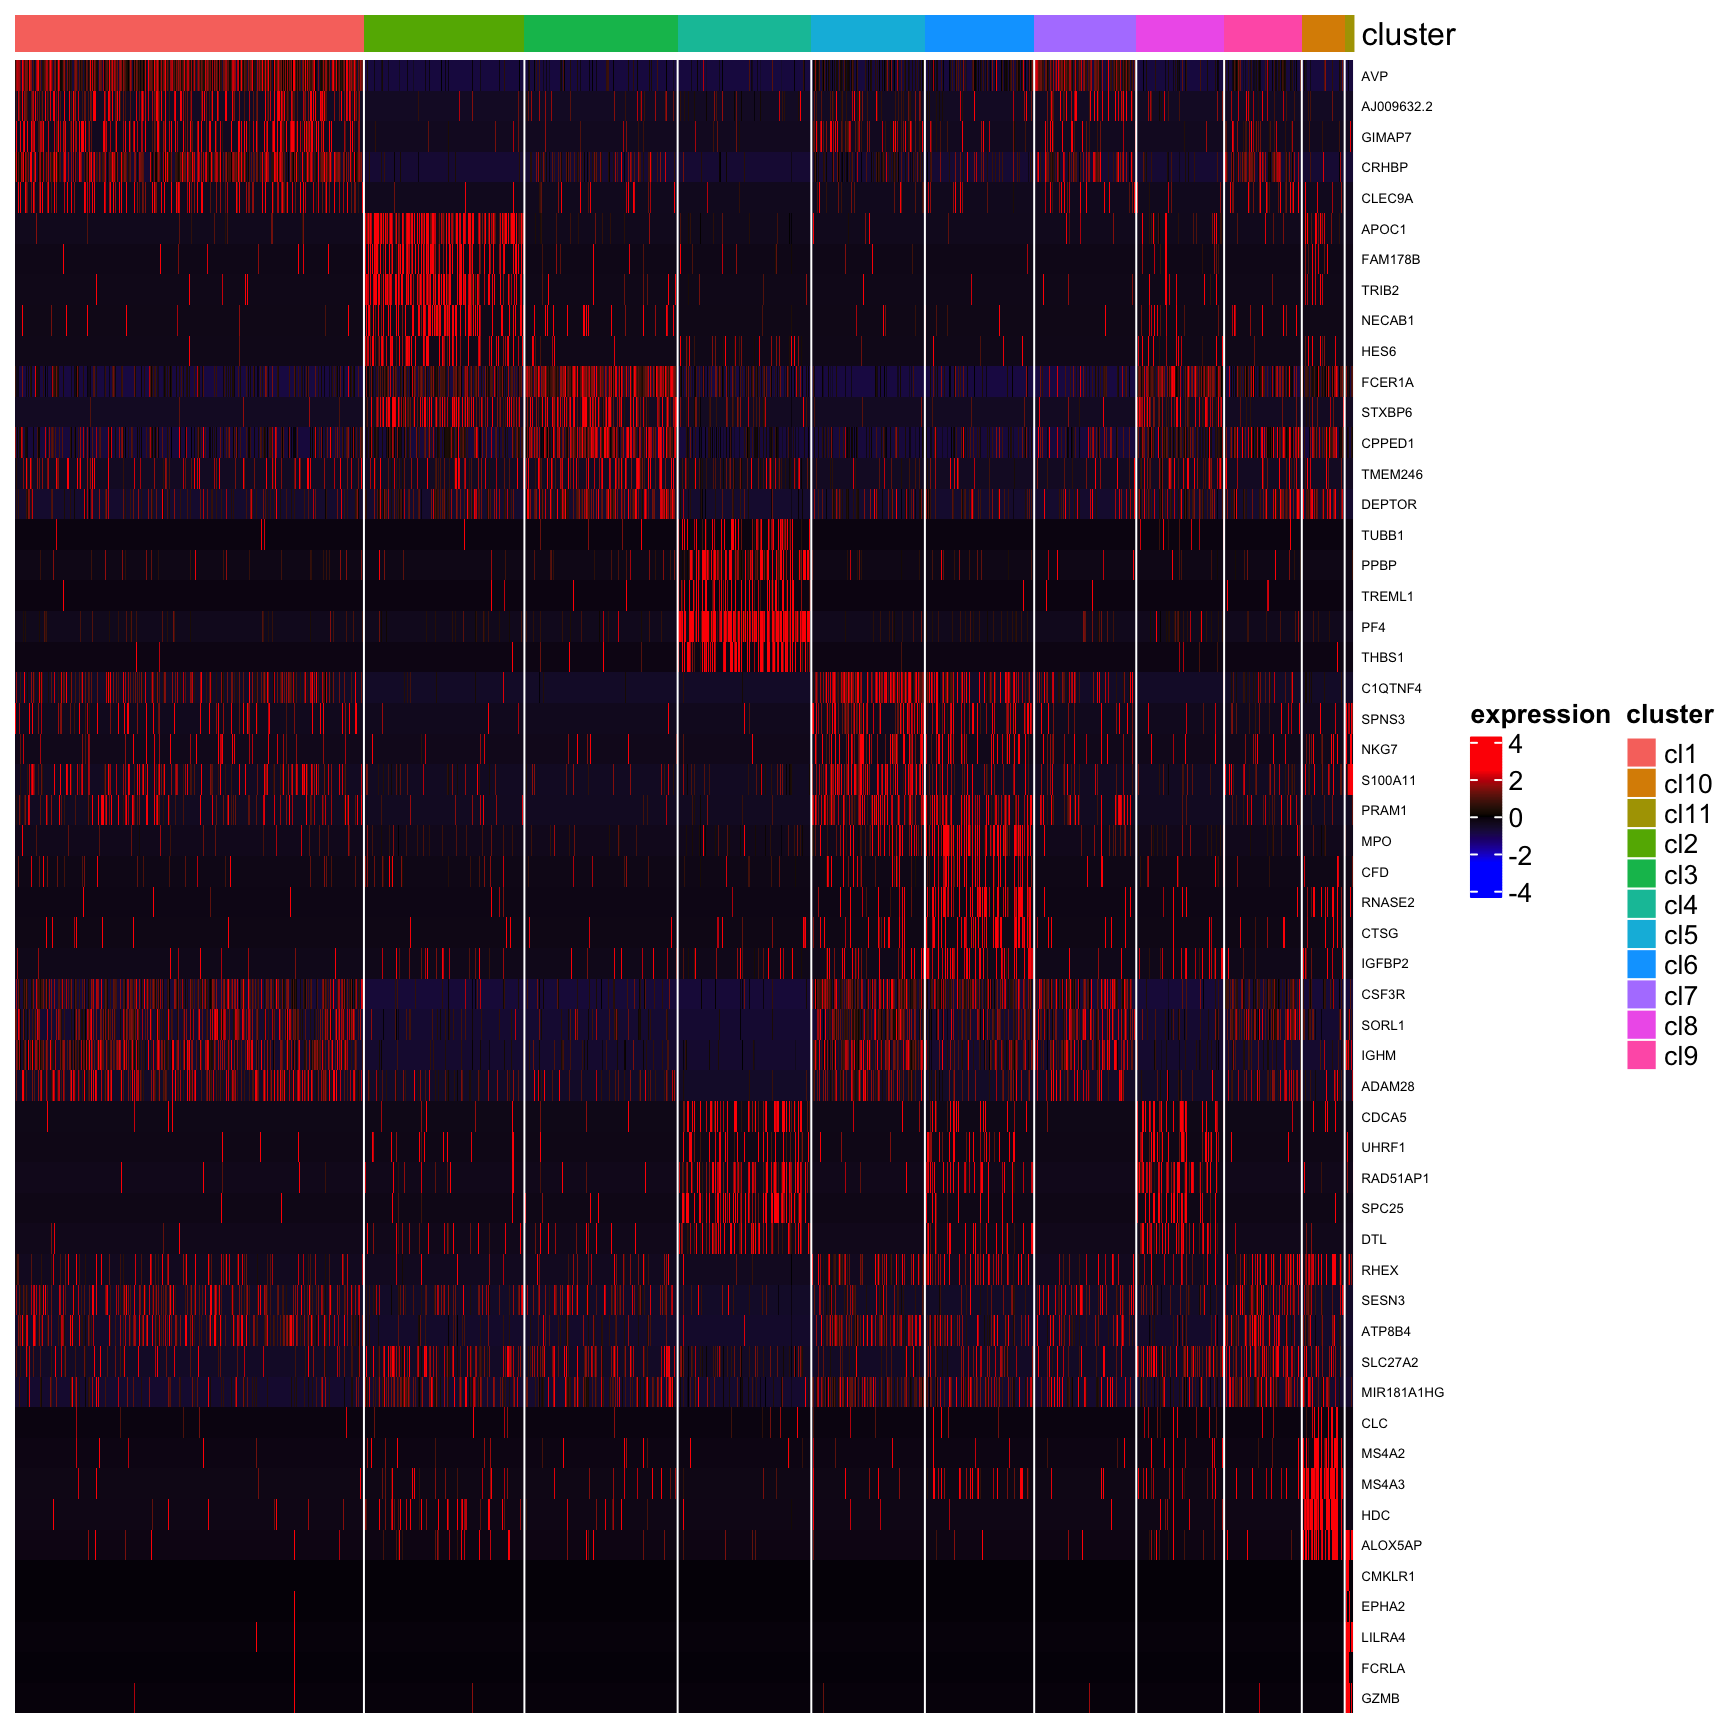
Contaminated cell-type removal
Cells found in the cluster11 express ‘GZMB’ and ‘EPHA2’, suggesting a contaminating population of plasmacytoid dendritic cells.
plot_umap_label_by_genes(human_HSPCs,gene_list = c("GZMB","EPHA2"))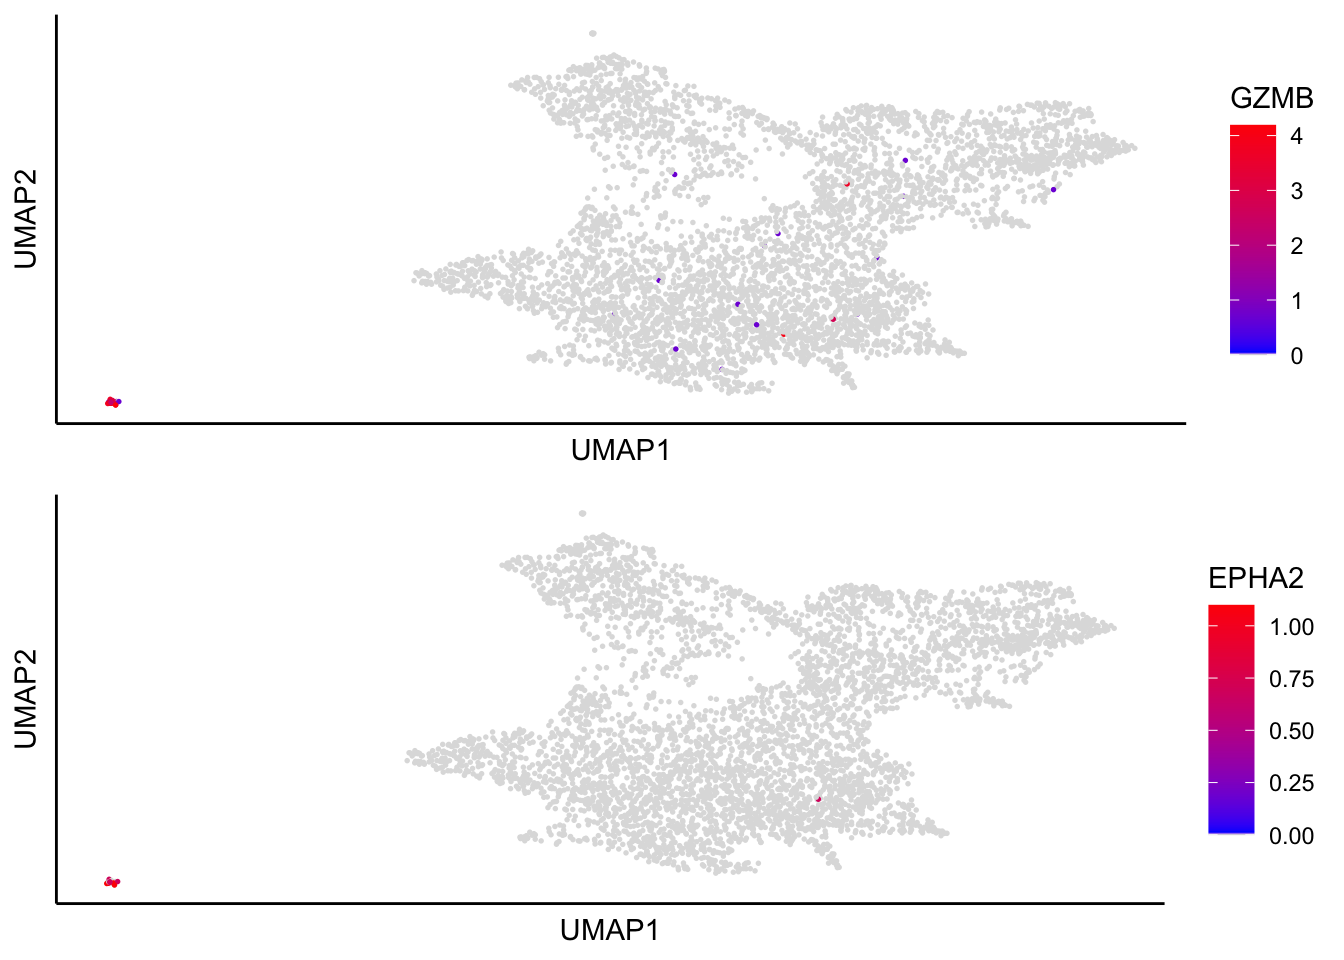
Therefore, these cells will be removed. To remove cells from the whole cluster10, the below function is performed.
remove_clusters(human_HSPCs,cluster.type = "louvain",cluster_ids = "cl10")## [1] "160 cells are removed. Please follow the pipeline steps starting from using the normalize_UMIs function!"
## [1] "The cell's metadata is updated!."After removing those cells, SingCellaR object will be updated. The user has to redo the analysis described in the followings.
normalize_UMIs(human_HSPCs,use.scaled.factor = T)## [1] "Normalization is completed!."get_variable_genes_by_fitting_GLM_model(human_HSPCs,mean_expr_cutoff = 0.05,disp_zscore_cutoff = 0.05)## [1] "Calculate row variance.."
##
|
| | 0%
|
|======== | 11%
|
|================ | 22%
|
|======================= | 33%
|
|=============================== | 44%
|
|======================================= | 56%
|
|=============================================== | 67%
|
|====================================================== | 78%
|
|============================================================== | 89%
|
|======================================================================| 100%[1] "Using :12720 genes for fitting the GLM model!"
## [1] "Identified :2262 variable genes"remove_unwanted_genes_from_variable_gene_set(human_HSPCs,gmt.file = "../SingCellaR_example_datasets/Human_genesets/human.ribosomal-mitocondrial.genes.gmt",
removed_gene_sets=c("Ribosomal_gene","Mitocondrial_gene"))## [1] "4 genes are removed from the variable gene set."runPCA(human_HSPCs,use.components=50,use.regressout.data = F)## [1] "PCA analysis is done!."plot_PCA_Elbowplot(human_HSPCs)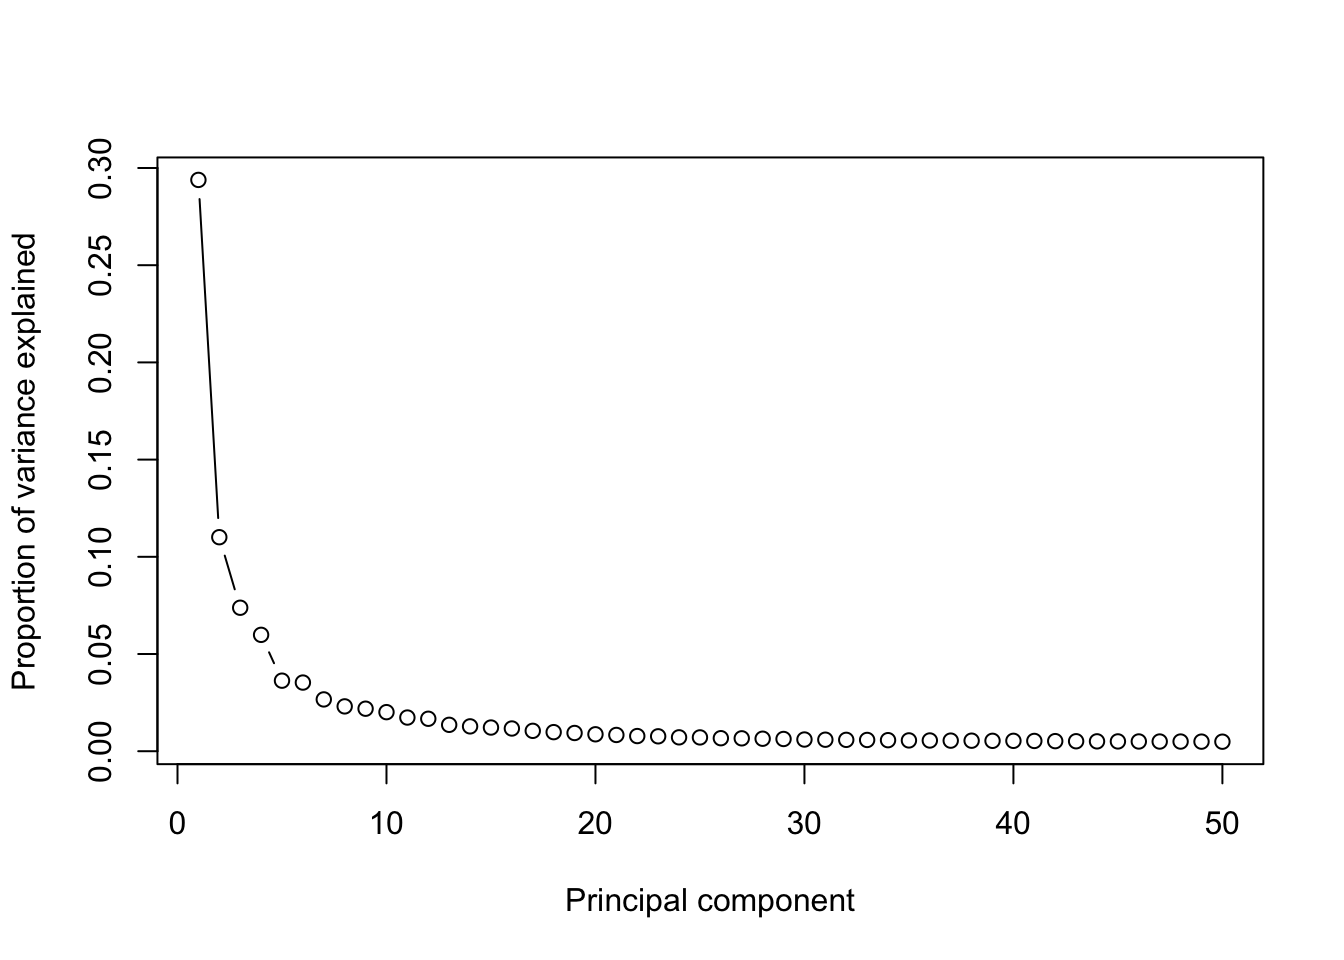
Next, harmony integration will be performed.
Harmony integration without the cluster10.
runHarmony(human_HSPCs,covariates = c("sampleID"),harmony.max.iter = 20)## Harmony 1/20## Harmony 2/20## Harmony 3/20## Harmony 4/20## Harmony 5/20## Harmony 6/20## Harmony 7/20## Harmony converged after 7 iterations## [1] "Harmony analysis is done!."Clustering analysis
identifyClusters(human_HSPCs,useIntegrativeEmbeddings = T,integrative_method = "harmony", n.dims.use = 20,n.neighbors = 50, knn.metric = "euclidean")## [1] "Building Annoy index with metric = euclidean , n_trees = 50"## 0% 10 20 30 40 50 60 70 80 90 100%## [----|----|----|----|----|----|----|----|----|----|## **************************************************|## [1] "Searching Annoy index, search_k = 5000"## 0% 10 20 30 40 50 60 70 80 90 100%
## [----|----|----|----|----|----|----|----|----|----|
## **************************************************|## [1] "Building graph network.."
## [1] "Building graph network is done."
## [1] "Process community detection.."
## [1] "Louvain analysis is done!."UMAP analysis
runUMAP(human_HSPCs,useIntegrativeEmbeddings = T, integrative_method = "harmony",n.dims.use = 20,
        n.neighbors = 30,uwot.metric = "euclidean")
## 17:09:15 UMAP embedding parameters a = 1.121 b = 1.057## 17:09:15 Read 4840 rows and found 20 numeric columns## 17:09:15 Using Annoy for neighbor search, n_neighbors = 30## 17:09:15 Building Annoy index with metric = euclidean, n_trees = 50## 0% 10 20 30 40 50 60 70 80 90 100%## [----|----|----|----|----|----|----|----|----|----|## **************************************************|
## 17:09:15 Writing NN index file to temp file /var/folders/c6/_w309xr54n7cphf9nw4x_ms40000gn/T//RtmpYIEquX/filec27b3d4428f5
## 17:09:15 Searching Annoy index using 8 threads, search_k = 3000
## 17:09:15 Annoy recall = 100%
## 17:09:16 Commencing smooth kNN distance calibration using 8 threads with target n_neighbors = 30
## 17:09:17 Initializing from normalized Laplacian + noise (using irlba)
## 17:09:17 Commencing optimization for 500 epochs, with 209010 positive edges
## 17:09:24 Optimization finished## [1] "UMAP analysis is done!."Plot UMAP with identified clusters
plot_umap_label_by_clusters(human_HSPCs,show_method = "louvain")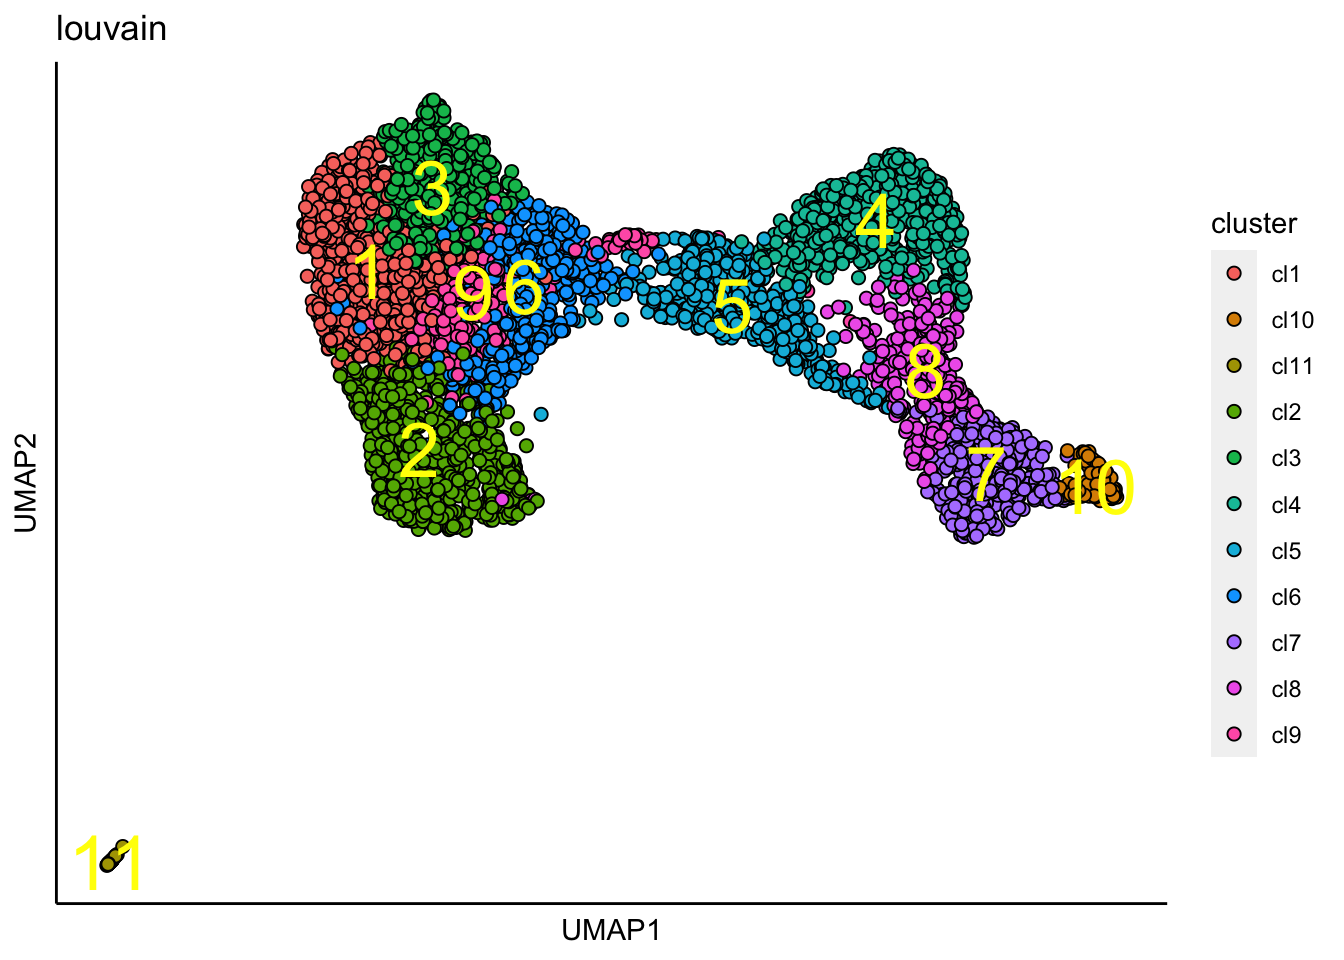
Force-directed graph trajectory analysis
runFA2_ForceDirectedGraph(human_HSPCs,n.dims.use = 20, useIntegrativeEmbeddings = T,integrative_method = "harmony",n.neighbors = 5,n.seed = 1,fa2_n_iter = 1000)## [1] "Building Annoy index with metric = euclidean , n_trees = 50"## 0% 10 20 30 40 50 60 70 80 90 100%## [----|----|----|----|----|----|----|----|----|----|## **************************************************|## [1] "Searching Annoy index, search_k = 500"## 0% 10 20 30 40 50 60 70 80 90 100%
## [----|----|----|----|----|----|----|----|----|----|
## **************************************************|## [1] "Processing fa2.."
## [1] "Force directed graph analysis is done!."plot_forceDirectedGraph_label_by_clusters(human_HSPCs,show_method = "louvain")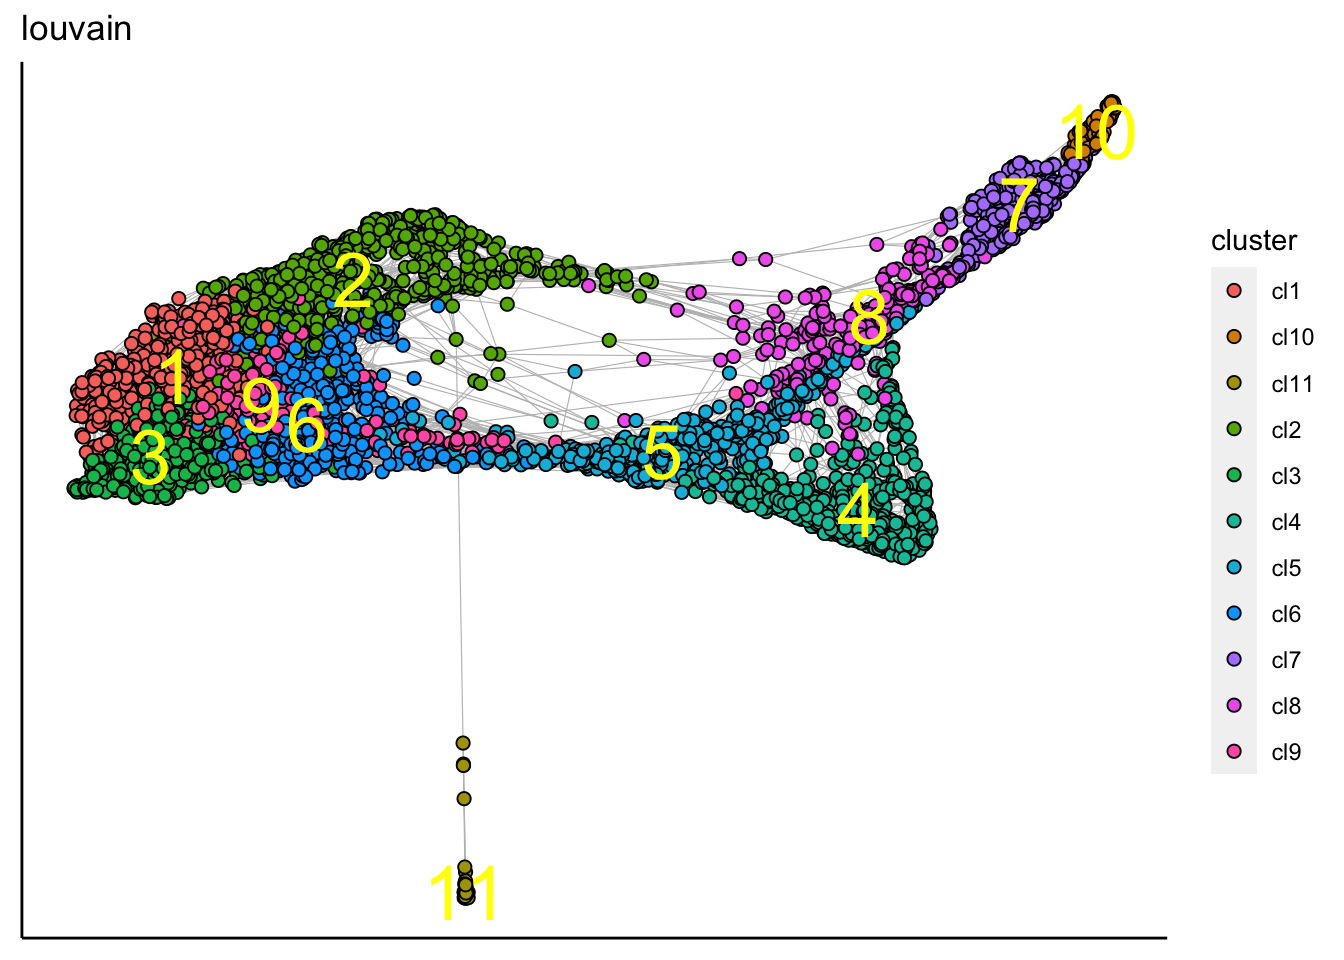
plot_forceDirectedGraph_label_by_multiple_gene_sets(human_HSPCs,gmt.file = "../SingCellaR_example_datasets/Human_genesets/human.signature.genes.v1.gmt",
                                      show_gene_sets = c("Erythroid","Lymphoid","Myeloid","Megakaryocyte"),
                                      custom_color = c("red","orange","cyan","purple"),
                                      isNormalizedByHouseKeeping = T,vertex.size = 1,edge.size = 0.05,
                                      background.color = "black")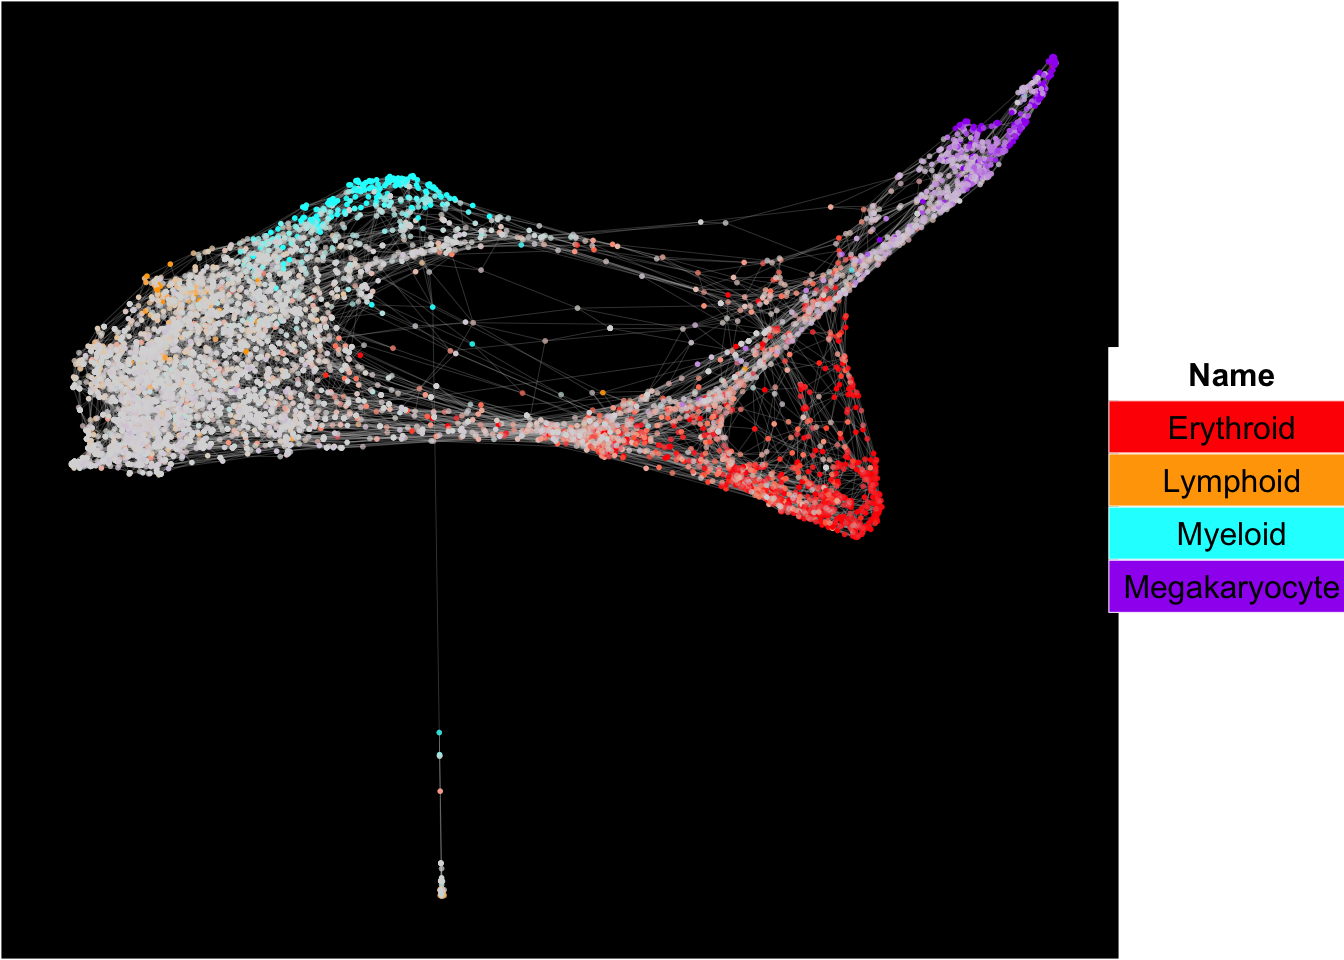
KNN-graph trajectory analysis
SingCellaR also provides an alternative KNN-graph for the trajectory visualization.
runKNN_Graph(human_HSPCs,n.dims.use = 20, useIntegrativeEmbeddings = T,integrative_method = "harmony")## [1] "Building Annoy index with metric = euclidean , n_trees = 50"## 0% 10 20 30 40 50 60 70 80 90 100%## [----|----|----|----|----|----|----|----|----|----|## **************************************************|## [1] "Searching Annoy index, search_k = 500"## 0% 10 20 30 40 50 60 70 80 90 100%
## [----|----|----|----|----|----|----|----|----|----|
## **************************************************|## [1] "Processing graph-layout.."
## [1] "KNN-Graph analysis is done!."KNN-graph visualization in 3D plot
Plot trajectory in 3D KNN-graph with identified clusters
library(threejs)## Loading required package: igraph##
## Attaching package: 'igraph'## The following objects are masked from 'package:stats':
##
## decompose, spectrum## The following object is masked from 'package:base':
##
## unionplot_3D_knn_graph_label_by_clusters(human_HSPCs,show_method = "louvain",vertext.size = 0.25)Plot trajectory in 3D KNN-graph with the expression of a selected gene set.
genesets<-get_gmtGeneSets("../SingCellaR_example_datasets/Human_genesets/human.signature.genes.v1.gmt")
plot_3D_knn_graph_label_by_a_signature_gene_set(human_HSPCs,gene_list = genesets[["Megakaryocyte"]],vertext.size = 0.40)
Diffusion map analysis
SingCellaR also provides Diffusion map for the trajectory visualization.
library(destiny)
runDiffusionMap(human_HSPCs,n.dims.use = 20, useIntegrativeEmbeddings = T,integrative_method = "harmony")
## [1] "This process will take time and requires large RAM depending on the number of cells in your analysis!"
## [1] "DiffusionMap analysis is done!."plot_diffusionmap_label_by_multiple_gene_sets(human_HSPCs,gmt.file = "../SingCellaR_example_datasets/Human_genesets/human.signature.genes.v1.gmt",
show_gene_sets = c("Erythroid","Lymphoid","Myeloid","Megakaryocyte"),
custom_color = c("red","orange","cyan","purple"),
isNormalizedByHouseKeeping = T,point.size = 0.8,
background.color = "black")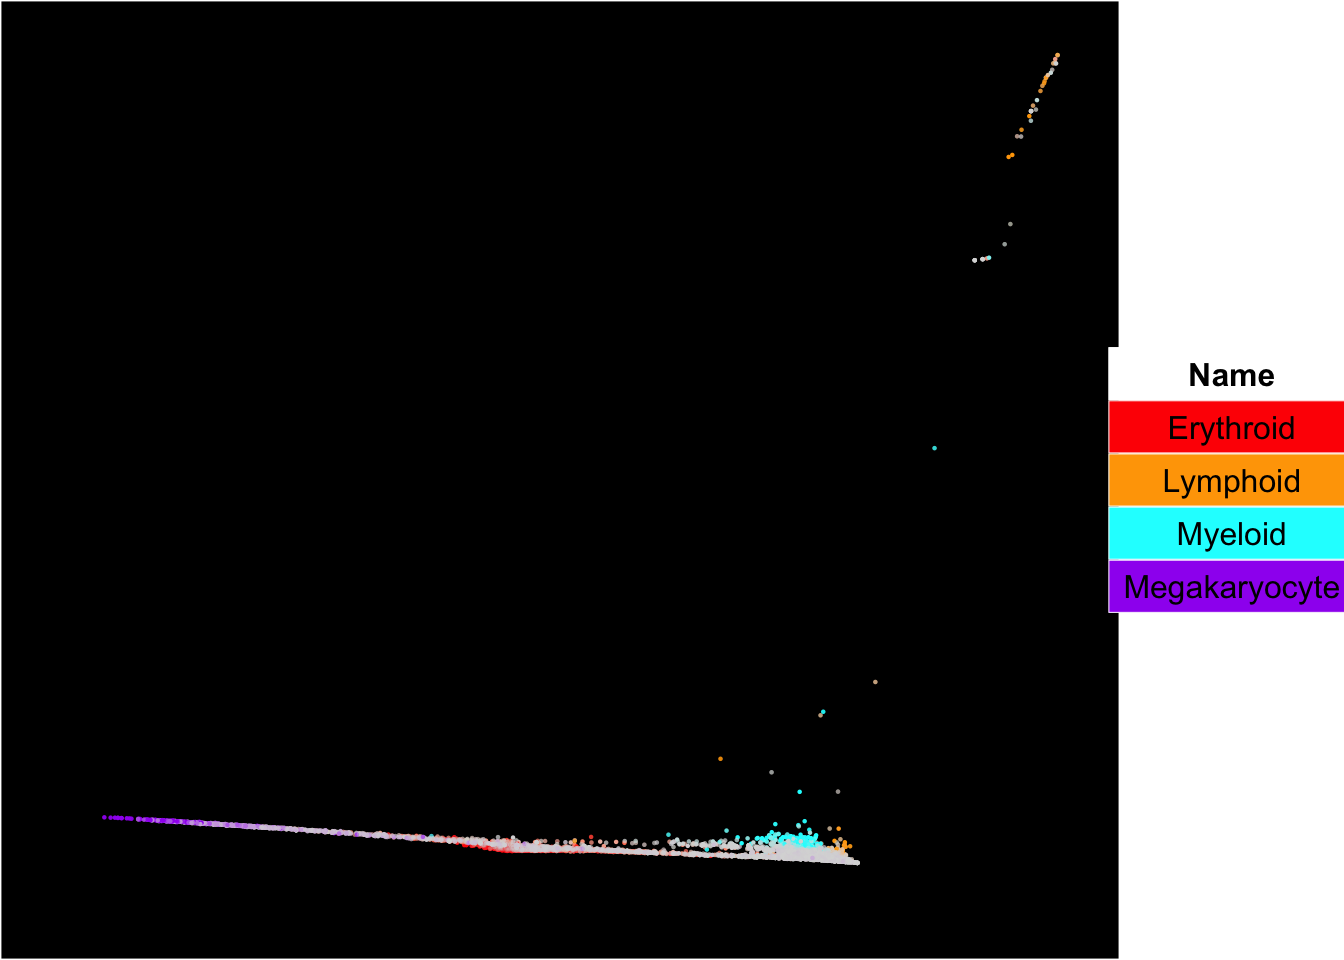
Marker gene identification
findMarkerGenes(human_HSPCs,cluster.type = "louvain")## [1] "Number of genes for analysis: 16184"
## [1] "Creating binary matrix.."
## [1] "Finding differential genes.."
## [1] "Identifying marker genes for: cl1"
## [1] "Processing Fisher's exact test!"
## [1] "Processing Wilcoxon Rank-sum test!"
## [1] "Combining p-values using the fisher's method!"
## [1] "Identifying marker genes for: cl2"
## [1] "Processing Fisher's exact test!"
## [1] "Processing Wilcoxon Rank-sum test!"
## [1] "Combining p-values using the fisher's method!"
## [1] "Identifying marker genes for: cl3"
## [1] "Processing Fisher's exact test!"
## [1] "Processing Wilcoxon Rank-sum test!"
## [1] "Combining p-values using the fisher's method!"
## [1] "Identifying marker genes for: cl4"
## [1] "Processing Fisher's exact test!"
## [1] "Processing Wilcoxon Rank-sum test!"
## [1] "Combining p-values using the fisher's method!"
## [1] "Identifying marker genes for: cl5"
## [1] "Processing Fisher's exact test!"
## [1] "Processing Wilcoxon Rank-sum test!"
## [1] "Combining p-values using the fisher's method!"
## [1] "Identifying marker genes for: cl6"
## [1] "Processing Fisher's exact test!"
## [1] "Processing Wilcoxon Rank-sum test!"
## [1] "Combining p-values using the fisher's method!"
## [1] "Identifying marker genes for: cl7"
## [1] "Processing Fisher's exact test!"
## [1] "Processing Wilcoxon Rank-sum test!"
## [1] "Combining p-values using the fisher's method!"
## [1] "Identifying marker genes for: cl8"
## [1] "Processing Fisher's exact test!"
## [1] "Processing Wilcoxon Rank-sum test!"
## [1] "Combining p-values using the fisher's method!"
## [1] "Identifying marker genes for: cl9"
## [1] "Processing Fisher's exact test!"
## [1] "Processing Wilcoxon Rank-sum test!"
## [1] "Combining p-values using the fisher's method!"
## [1] "Identifying marker genes for: cl10"
## [1] "Processing Fisher's exact test!"
## [1] "Processing Wilcoxon Rank-sum test!"
## [1] "Combining p-values using the fisher's method!"
## [1] "Identifying marker genes for: cl11"
## [1] "Processing Fisher's exact test!"
## [1] "Processing Wilcoxon Rank-sum test!"
## [1] "Combining p-values using the fisher's method!"## Warning in object@marker.genes$louvain <- MarkerGenes: Coercing LHS to a listplot_heatmap_for_marker_genes(human_HSPCs,cluster.type = "louvain",n.TopGenes = 10,rowFont.size = 5)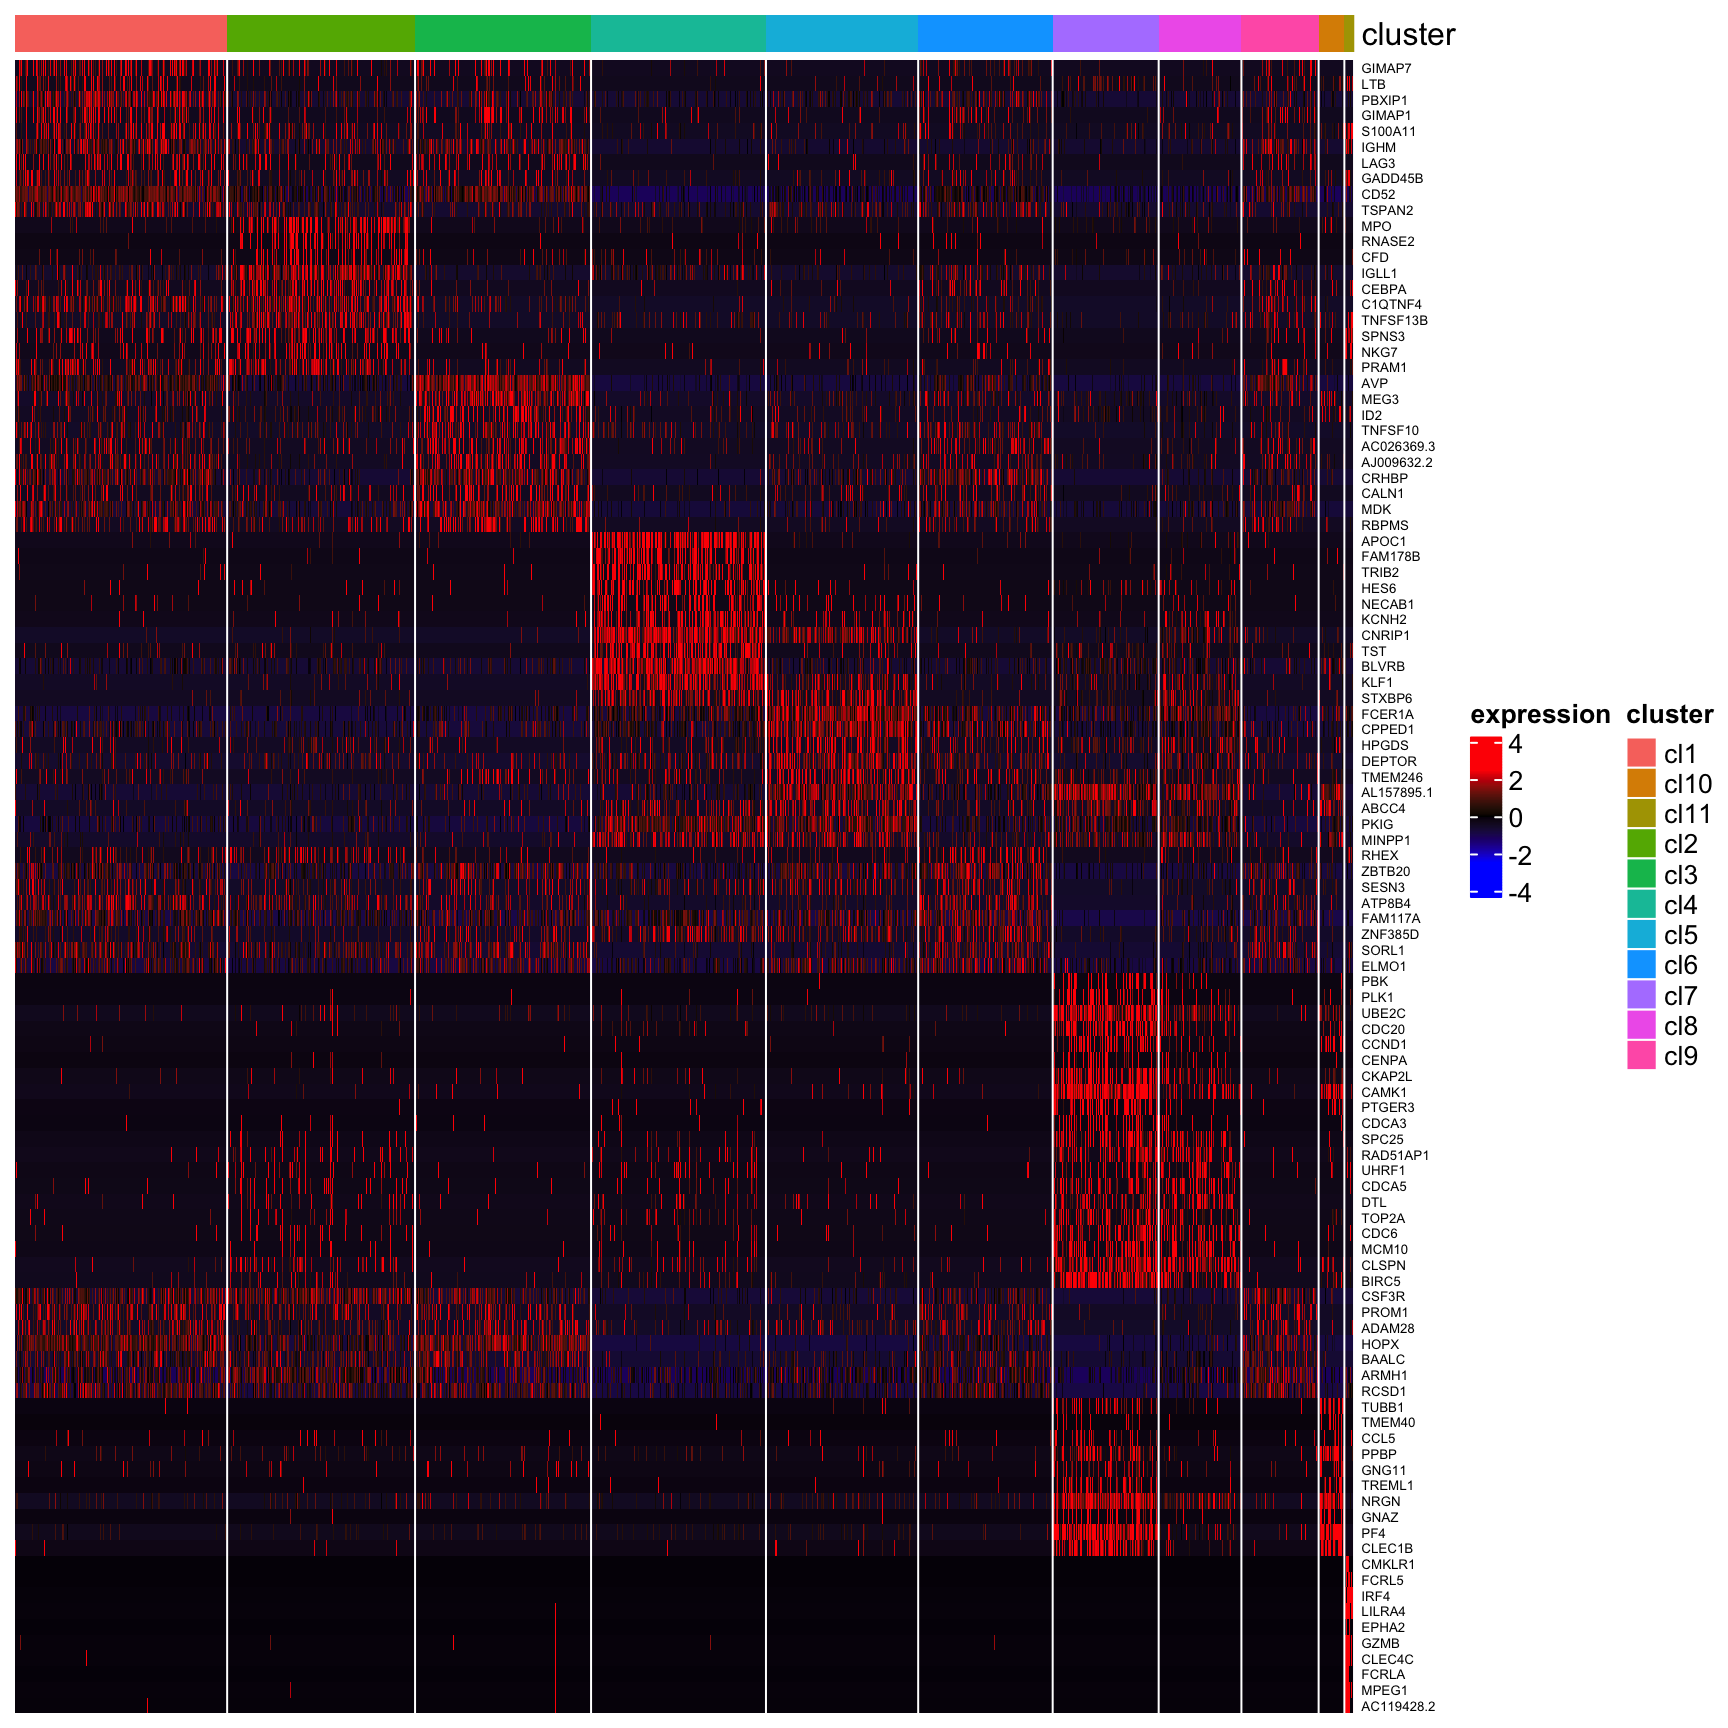
Plot UMAP with identified marker genes
plot_umap_label_by_genes(human_HSPCs,gene_list = c("AVP","CNRIP1","MPO","PF4"))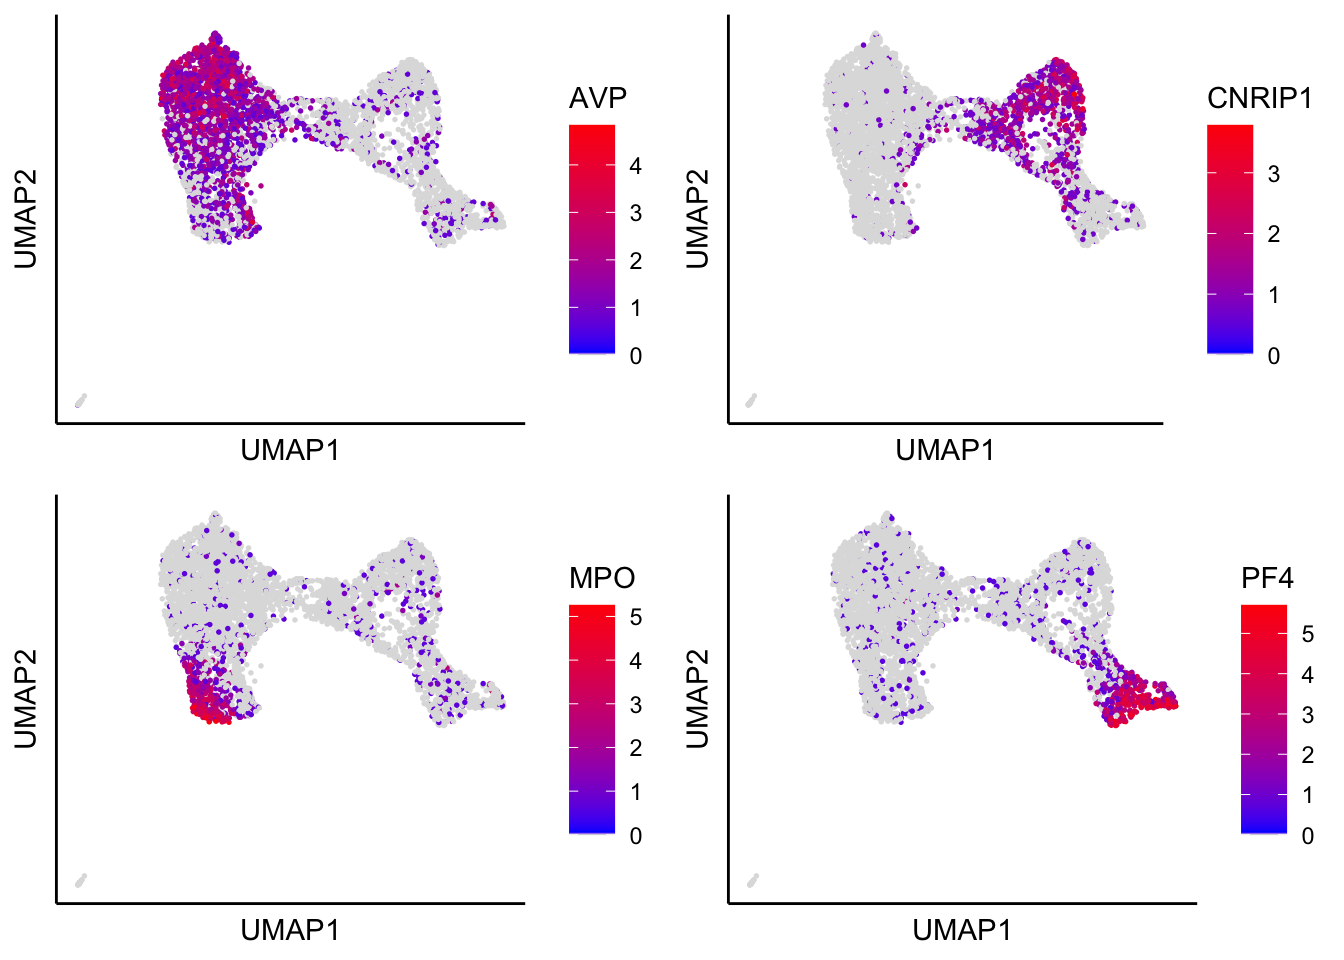
Plot force-directed graph with identified marker genes
plot_forceDirectedGraph_label_by_genes(human_HSPCs,gene_list = c("AVP","CNRIP1","MPO","PF4"))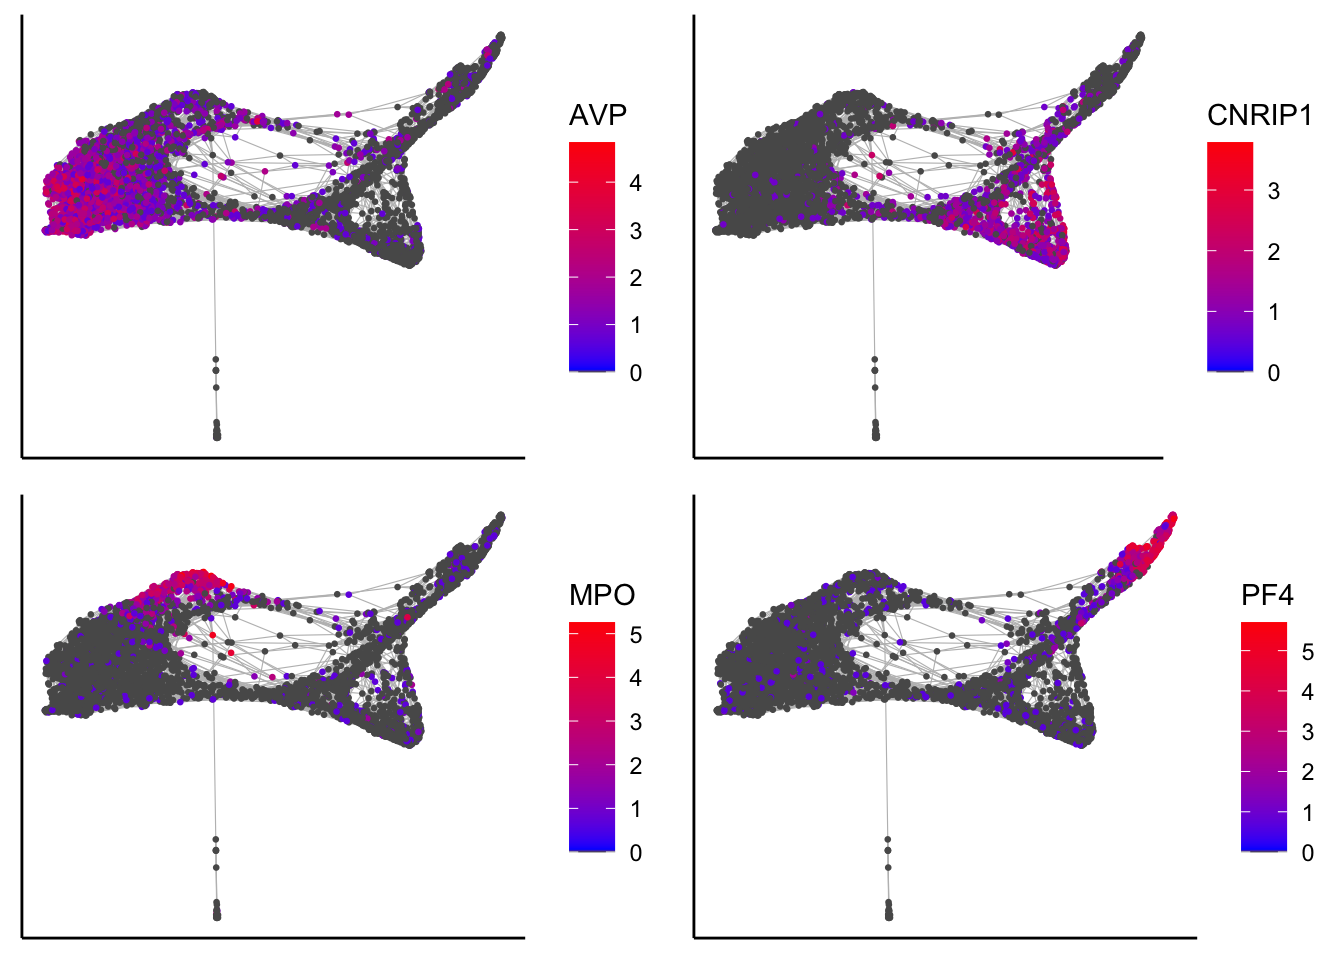
Violin plot for identified marker genes
plot_violin_for_marker_genes(human_HSPCs,gene_list = c("AVP","CNRIP1","MPO","PF4"))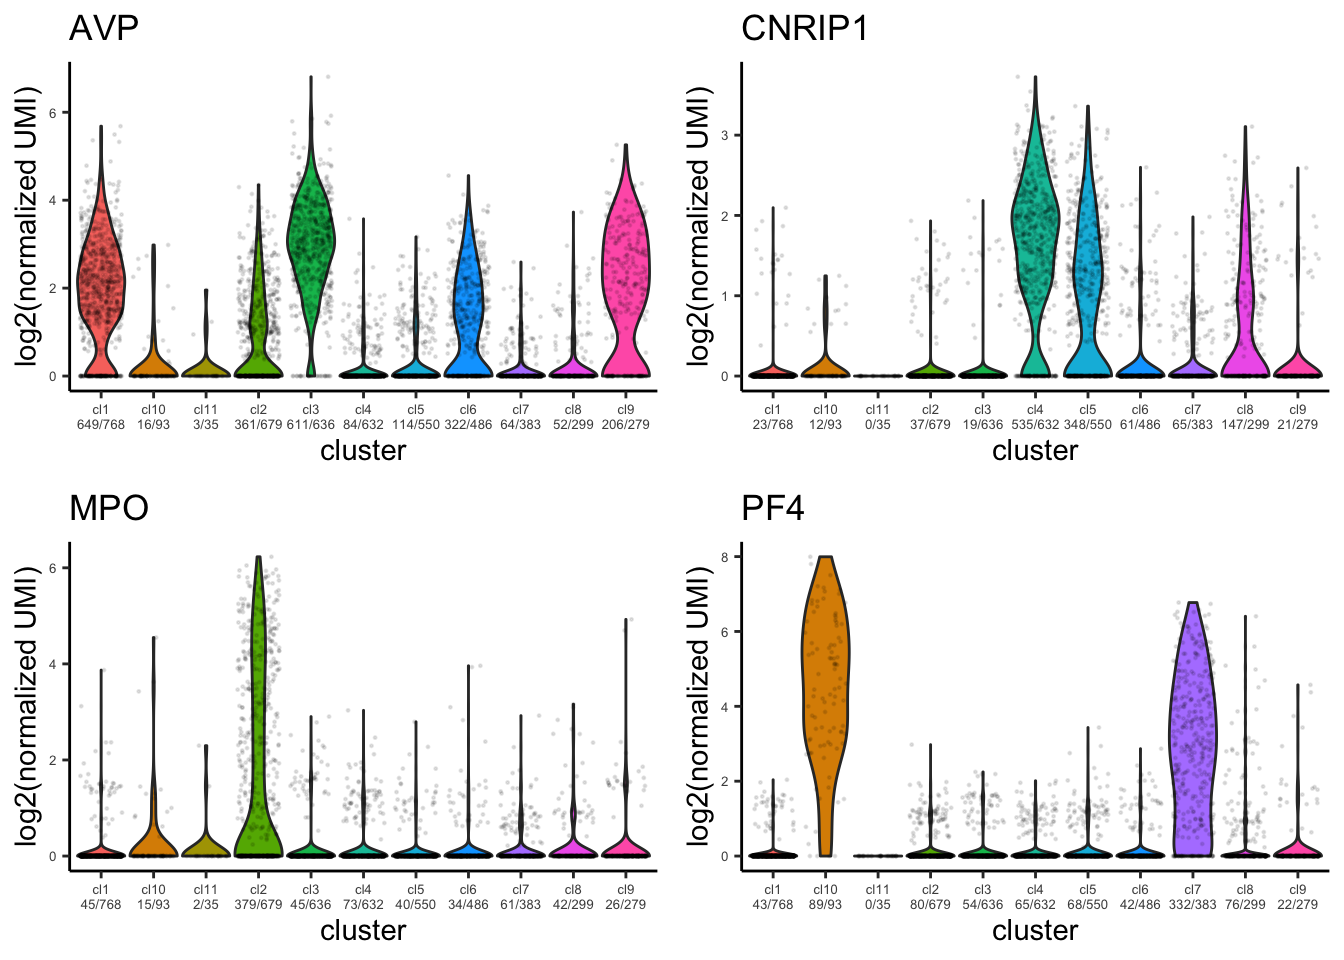
Bubble plot for identified marker genes
plot_bubble_for_genes_per_cluster(human_HSPCs,cluster.type = "louvain",
                            gene_list=c("AVP","CLEC9A",
                                        "APOE","CNRIP1",
                                        "MPO","AZU1",
                                        "PF4"),show.percent = T,buble.scale = 12,point.color1 = "gray",
                                        point.color2 = "firebrick1")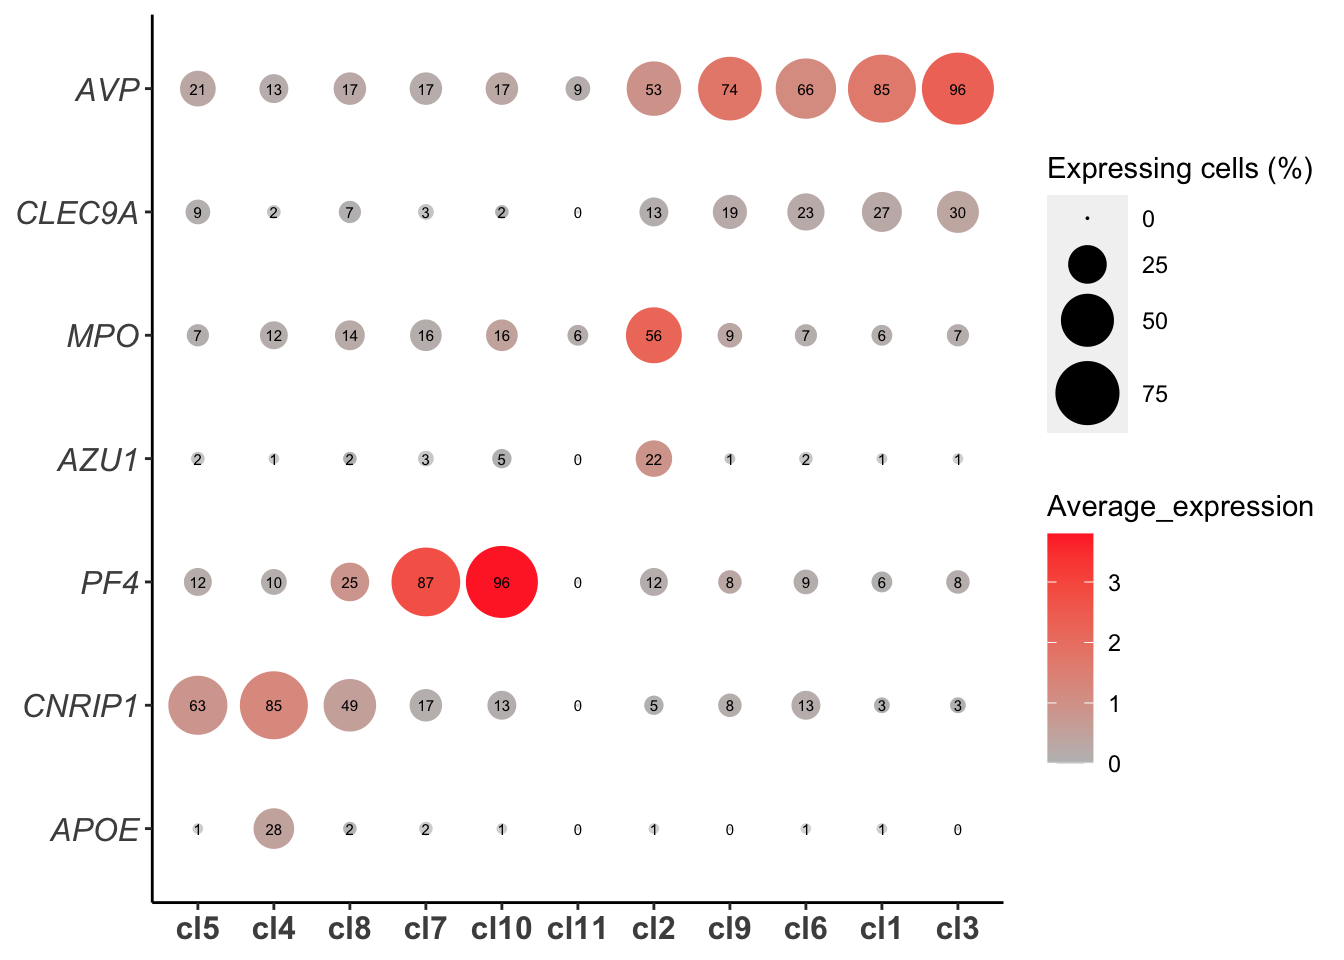
GSEA analysis
GSEA analysis requires pre-ranked genes as the input for the gene set enrichment testing. The function below will be performed to rank differential genes, based on the combination of log2 foldchange and adjusted-pvalue.
Preparation for the pre-ranked genes
pre_rankedGenes_for_GSEA<-identifyGSEAPrerankedGenes_for_all_clusters(human_HSPCs,
                                                                    cluster.type = "louvain")
## [1] "Identifying differentially expressed genes for: cl1"
## [1] "Processing Fisher's exact test!"
## [1] "Identifying differentially expressed genes for: cl2"
## [1] "Processing Fisher's exact test!"
## [1] "Identifying differentially expressed genes for: cl3"
## [1] "Processing Fisher's exact test!"
## [1] "Identifying differentially expressed genes for: cl4"
## [1] "Processing Fisher's exact test!"
## [1] "Identifying differentially expressed genes for: cl5"
## [1] "Processing Fisher's exact test!"
## [1] "Identifying differentially expressed genes for: cl6"
## [1] "Processing Fisher's exact test!"
## [1] "Identifying differentially expressed genes for: cl7"
## [1] "Processing Fisher's exact test!"
## [1] "Identifying differentially expressed genes for: cl8"
## [1] "Processing Fisher's exact test!"
## [1] "Identifying differentially expressed genes for: cl9"
## [1] "Processing Fisher's exact test!"
## [1] "Identifying differentially expressed genes for: cl10"
## [1] "Processing Fisher's exact test!"
## [1] "Identifying differentially expressed genes for: cl11"
## [1] "Processing Fisher's exact test!"To make this process more efficient, the user might want to save this pre-ranked gene results to the object.
save(pre_rankedGenes_for_GSEA,file="../SingCellaR_example_datasets/Psaila_et_al/SingCellaR_objects/human_HSPCs_preRankedGenes_for_GSEA.rdata")Run fGSEA
SinceCellaR uses fGSEA (https://bioconductor.org/packages/release/bioc/html/fgsea.html) for the gene set enrichment analysis. This process requires the GMT file that contains the gene sets. SingCellaR provides curated gene sets including the HALLMARK gene sets. The user can provide customized gene sets for the analysis.
GSEA analysis for hematopoietic lineage gene sets
load("../SingCellaR_example_datasets/Psaila_et_al/SingCellaR_objects/human_HSPCs_preRankedGenes_for_GSEA.rdata")
fgsea_Results<-Run_fGSEA_for_multiple_comparisons(GSEAPrerankedGenes_list = pre_rankedGenes_for_GSEA,nPermSimple=2000,
                    gmt.file = "../SingCellaR_example_datasets/Human_genesets/human.hematopoiesis.signature.genes.gmt")
## [1] "Processing fGSEA for:cl1"
## [1] "Processing fGSEA for:cl2"
## [1] "Processing fGSEA for:cl3"
## [1] "Processing fGSEA for:cl4"
## [1] "Processing fGSEA for:cl5"
## [1] "Processing fGSEA for:cl6"
## [1] "Processing fGSEA for:cl7"
## [1] "Processing fGSEA for:cl8"## Warning in fgseaMultilevel(pathways = my.db, stats = prerank.genes, minSize =
## minSize, : There were 1 pathways for which P-values were not calculated properly
## due to unbalanced (positive and negative) gene-level statistic values. For such
## pathways pval, padj, NES, log2err are set to NA. You can try to increase the
## value of the argument nPermSimple (for example set it nPermSimple = 20000)## [1] "Processing fGSEA for:cl9"## Warning in fgseaMultilevel(pathways = my.db, stats = prerank.genes, minSize =
## minSize, : There were 1 pathways for which P-values were not calculated properly
## due to unbalanced (positive and negative) gene-level statistic values. For such
## pathways pval, padj, NES, log2err are set to NA. You can try to increase the
## value of the argument nPermSimple (for example set it nPermSimple = 20000)## [1] "Processing fGSEA for:cl10"
## [1] "Processing fGSEA for:cl11"Plot GSEA analysis result
plot_heatmap_for_fGSEA_all_clusters(fgsea_Results,isApplyCutoff = TRUE,
                                    use_pvalues_for_clustering=T,
                                    show_NES_score = T,fontsize_row = 5,
                                    adjusted_pval = 0.10,
                                    show_only_NES_positive_score = T,format.digits = 3,
                                    clustering_method = "ward.D",
                                    clustering_distance_rows = "euclidean",
                                    clustering_distance_cols = "euclidean",show_text_for_ns = F)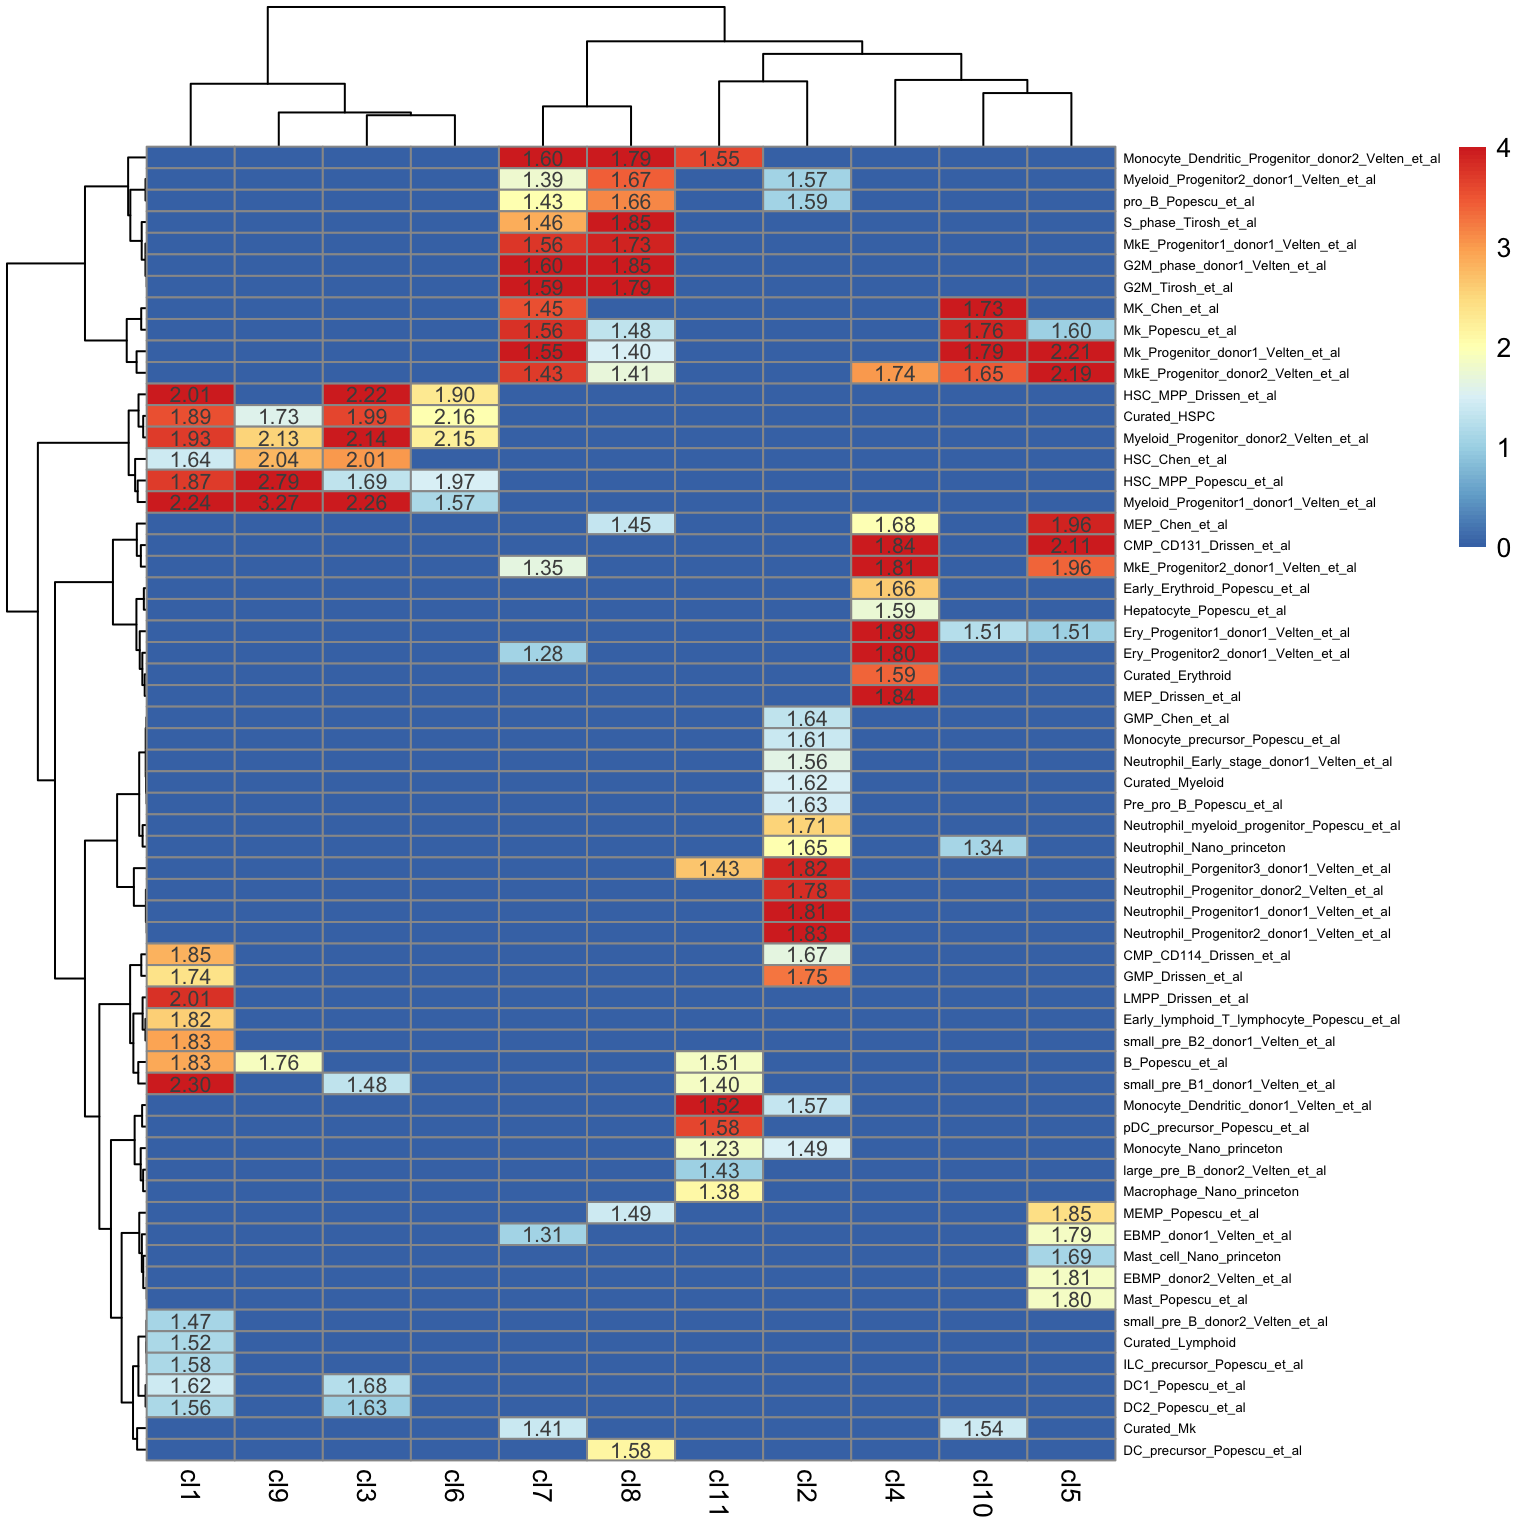
AUCell analysis
SingCellaR incorporates AUCell analysis for the AUCell score calculation. To run the analysis, AUCell package needs to be installed. See more details at https://www.bioconductor.org/packages/release/bioc/html/AUCell.html.
First, the function ‘AUCell_buildRankings’ will be performed and the AUCell_buildRankings object will be saved.
library(AUCell)

Build_AUCell_Rankings(human_HSPCs,AUCell_buildRankings.file="../SingCellaR_example_datasets/Psaila_et_al/SingCellaR_objects/human_life_cells_rankings.AUCells.rdata")
Alternatively, the function ‘Build_AUCell_Rankings_Fast’ can be used to speed up the process of AUCell gene rankings.
Next, the AUCell analysis is performed as described below.
set.seed(1)
human_HSPCs.AUCells.score<-Run_AUCell(human_HSPCs,"../SingCellaR_example_datasets/Psaila_et_al/SingCellaR_objects/human_life_cells_rankings.AUCells.rdata","../SingCellaR_example_datasets/Human_genesets/human.signature.genes.v1.gmt")
## Genes in the gene sets NOT available in the dataset:
## G2M_Core: 2 (4% of 54)
## S_phase_Core: 1 (2% of 43)
## Quiescence: 8 (6% of 127)head(human_HSPCs.AUCells.score)## G2M_Core S_phase_Core Erythroid Myeloid
## TAGTACCTCTCTCG-1_Sample21 0.03694685 0.09495045 0.17445137 0.02055306
## AAGTTCGCAGGGATAC-1_Sample11 0.06087899 0.05099884 0.39492785 0.00000000
## TCCTTTCCATCGAAGG-1_Sample6 0.03323002 0.02234974 0.00000000 0.00000000
## ACGTAACTCCAAGCTA-1_Sample11 0.04758465 0.01412320 0.01349159 0.00000000
## TACGATCTTTATCC-1_Sample21 0.09238459 0.18168874 0.00000000 0.00000000
## TGGAGAGGTGCAGTGA-1_Sample11 0.07479086 0.02165940 0.22841773 0.00000000
## Lymphoid Megakaryocyte Erythroid_Megakaryocyte
## TAGTACCTCTCTCG-1_Sample21 0 0.00000000 0.10191559
## AAGTTCGCAGGGATAC-1_Sample11 0 0.00000000 0.23071935
## TCCTTTCCATCGAAGG-1_Sample6 0 0.00000000 0.00000000
## ACGTAACTCCAAGCTA-1_Sample11 0 0.01170848 0.01277063
## TACGATCTTTATCC-1_Sample21 0 0.13584229 0.05671955
## TGGAGAGGTGCAGTGA-1_Sample11 0 0.00000000 0.13344308
## HSPC_MPP Eosinophil_Basophil_Mast
## TAGTACCTCTCTCG-1_Sample21 0.19847651 0.10145451
## AAGTTCGCAGGGATAC-1_Sample11 0.05272253 0.03181864
## TCCTTTCCATCGAAGG-1_Sample6 0.16740725 0.10673087
## ACGTAACTCCAAGCTA-1_Sample11 0.35872478 0.02060387
## TACGATCTTTATCC-1_Sample21 0.04711525 0.03884041
## TGGAGAGGTGCAGTGA-1_Sample11 0.02581464 0.04915237
## Endothelial_cells Quiescence random_gene
## TAGTACCTCTCTCG-1_Sample21 0 0.10567344 0.06445790
## AAGTTCGCAGGGATAC-1_Sample11 0 0.08624229 0.06651763
## TCCTTTCCATCGAAGG-1_Sample6 0 0.14708741 0.06629008
## ACGTAACTCCAAGCTA-1_Sample11 0 0.22231750 0.06207655
## TACGATCTTTATCC-1_Sample21 0 0.05545075 0.06574988
## TGGAGAGGTGCAGTGA-1_Sample11 0 0.14098626 0.06543288Plot UMAP with AUCell scores
plot_umap_label_by_AUCell_score(human_HSPCs,AUCell_gene_set_name=c("Megakaryocyte"),
                                human_HSPCs.AUCells.score,AUCell_cutoff=0.10,point.size = 0.5)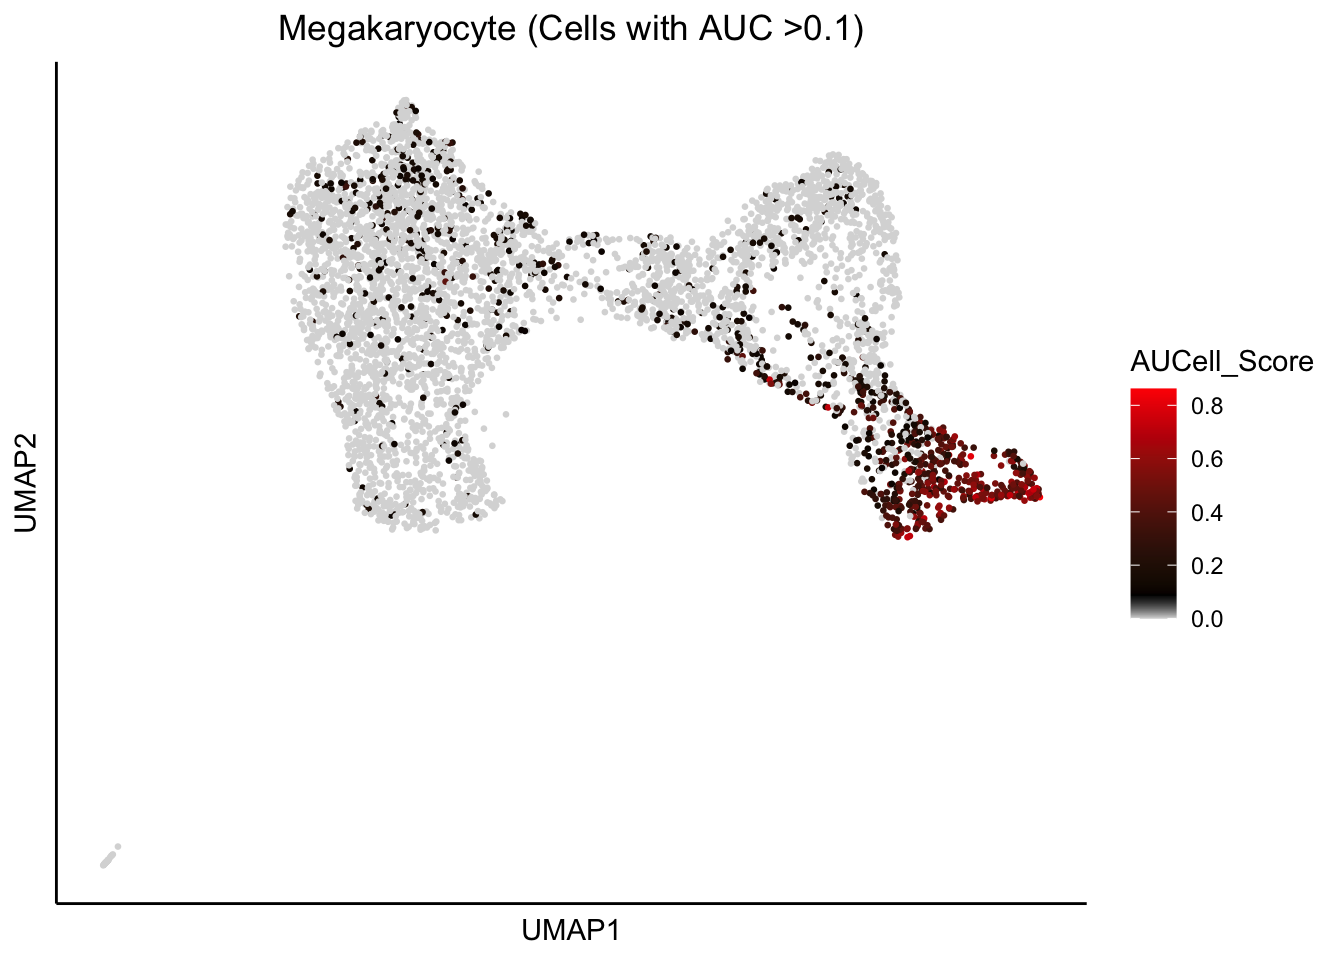
plot_umap_label_by_AUCell_score(human_HSPCs,AUCell_gene_set_name=c("Erythroid"),
                                human_HSPCs.AUCells.score,AUCell_cutoff=0.10,point.size = 0.5)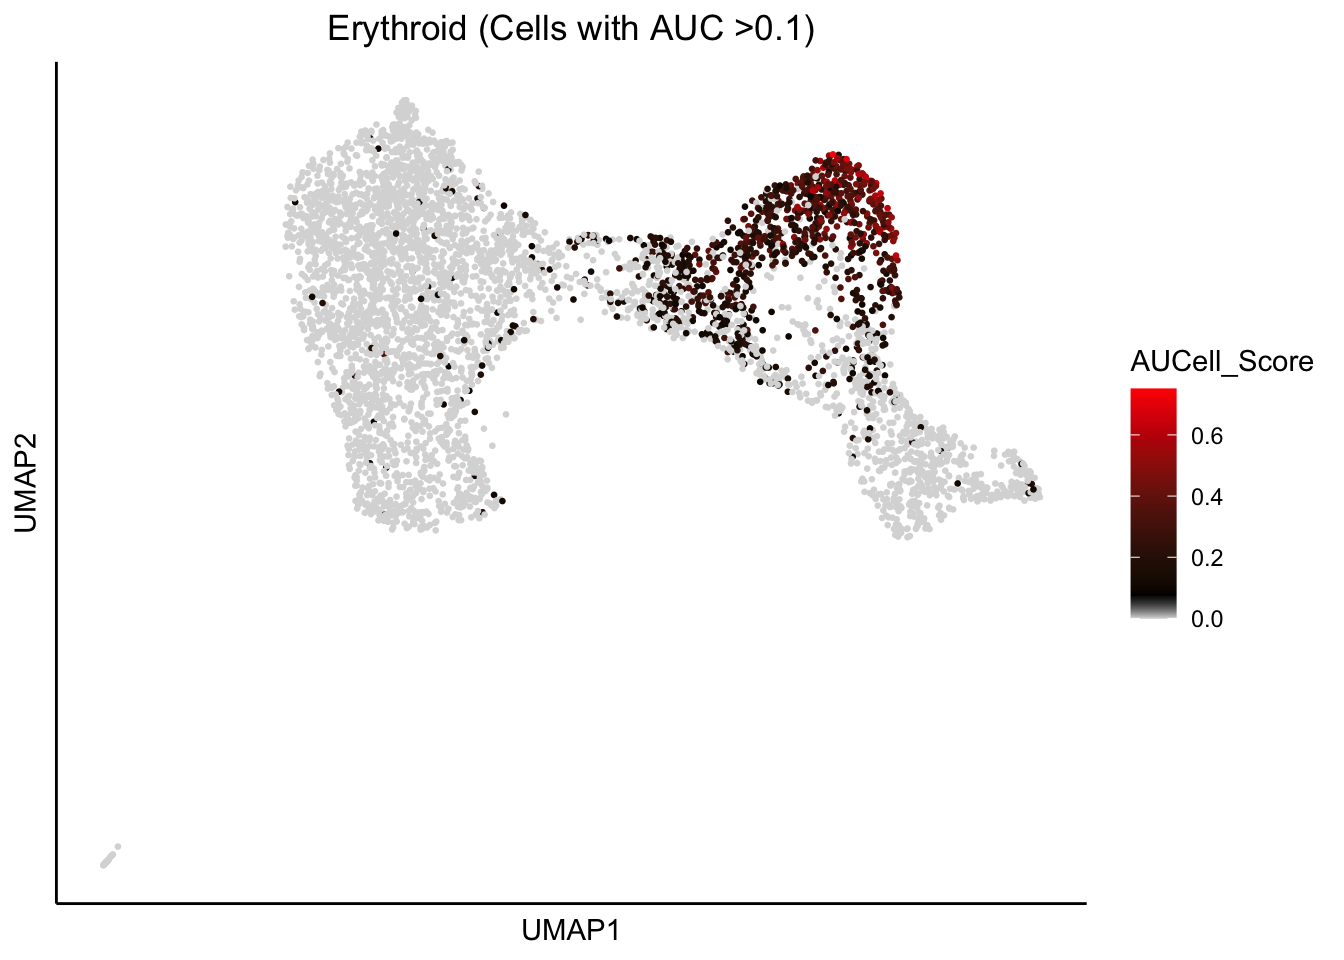
Plot force-directed graph with AUCell scores
plot_forceDirectedGraph_label_by_AUCell_score(human_HSPCs,AUCell_gene_set_name=c("Megakaryocyte"),
                                human_HSPCs.AUCells.score,AUCell_cutoff=0.10,vertex.size = 0.5)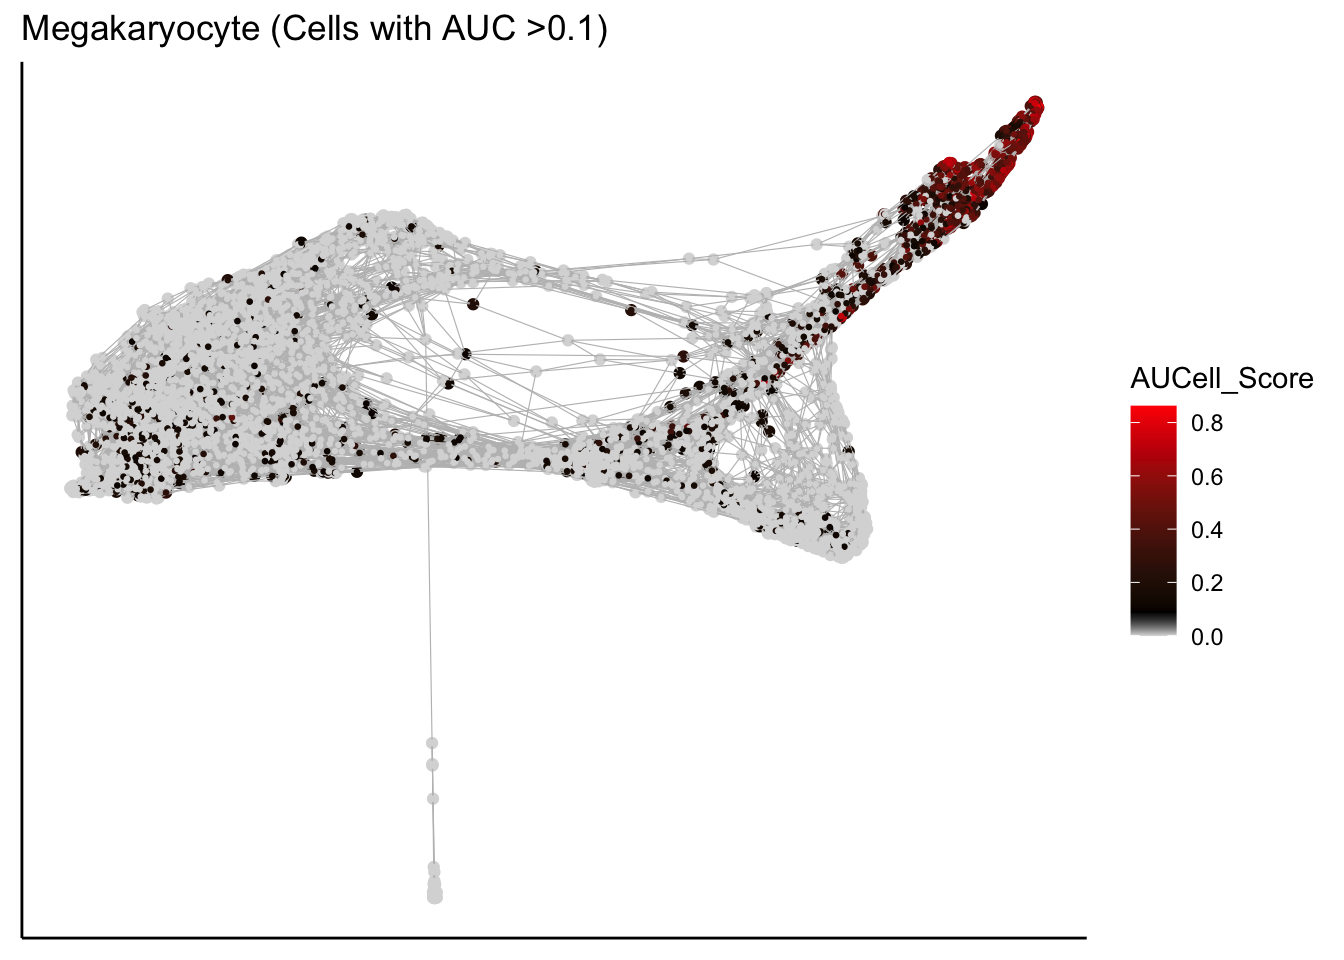
plot_forceDirectedGraph_label_by_AUCell_score(human_HSPCs,AUCell_gene_set_name=c("Erythroid"),
                                human_HSPCs.AUCells.score,AUCell_cutoff=0.10,vertex.size = 0.5)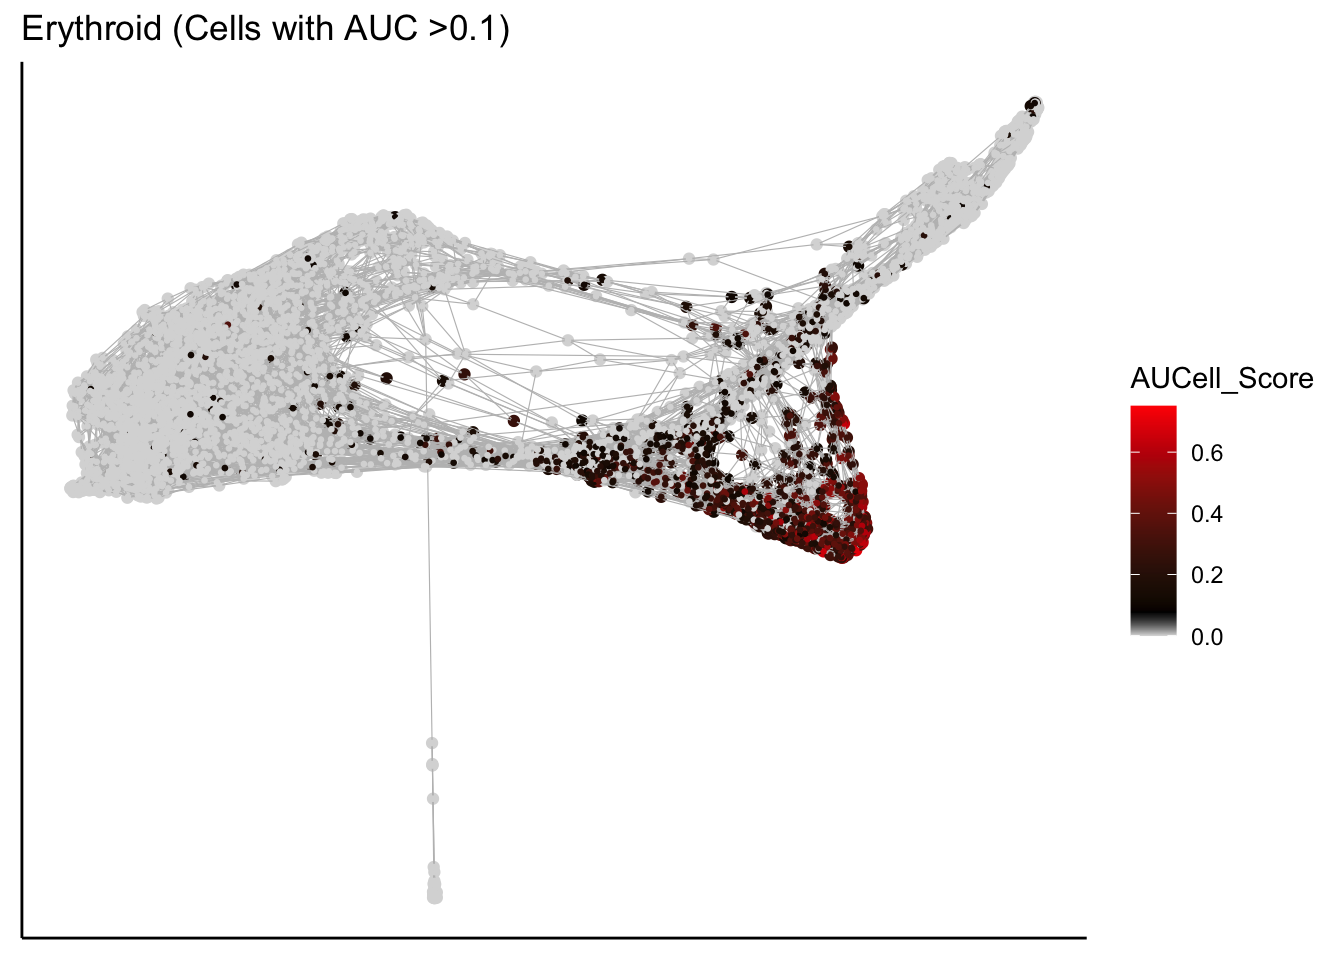
Save SingCellaR integrative object for further downstream analyses
save(human_HSPCs,file="../SingCellaR_example_datasets/Psaila_et_al/SingCellaR_objects/human_HSPCs_v0.2.SingCellaR.rdata")